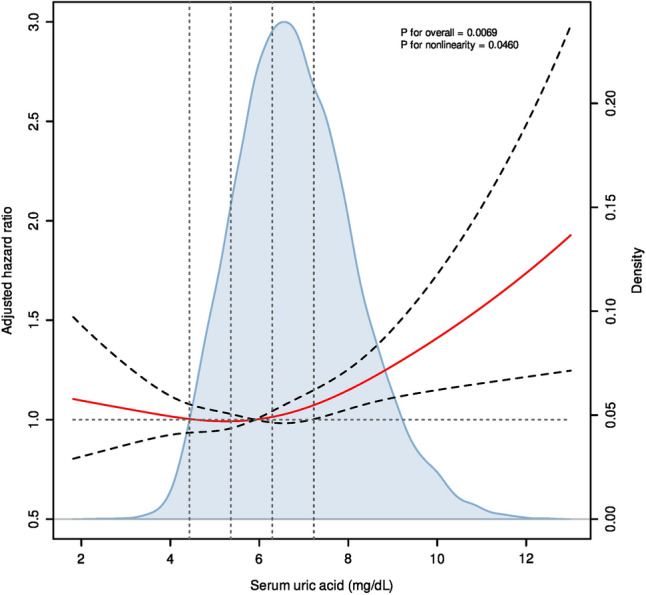
Figure 2.

Dose‒response curves for serum uric acid levels and mortality. Hazard ratio (HR) (labeled as red curves) and 95% confidence intervals (labeled as black dashed curves) were adjusted for age, sex, race, body mass index (categorial), hypertension, diabetes, albumin (categorial), albumin/globulin ratio (categorial), chronic kidney disease stages (categorial) and National Health and Nutrition Examination Survey cycle. The horizontal dotted line represents the reference HR, and vertical dotted lines are illustrated according to the quintile of serum uric acid concentrations. The blue-shaded area indicates the probability density distribution of serum uric acid concentrations. To decrease the influence of outliers, individuals with the ten largest and ten smallest serum uric acid concentrations were removed before illustration.
