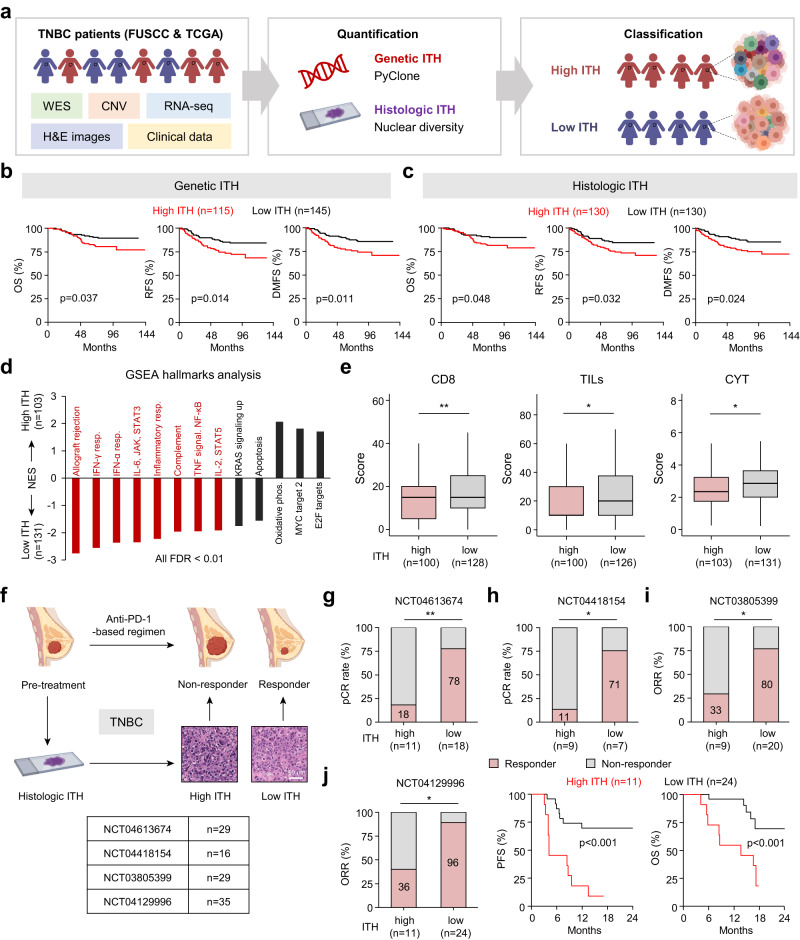
Fig. 1. High ITH reduces patient survival and confers immunotherapy resistance in TNBC.
a Flow chart of ITH analysis in TNBC. b, c Kaplan–Meier analyses of the OS, RFS and DMFS of FUSCC patients grouped according to genetic ITH (b) and histologic ITH (c). d Normalized enrichment score (NES) for hallmark gene sets correlated with genetic ITH levels in the FUSCC cohort. Red indicates immune gene sets. FDR false discovery rate, phos. phosphorylation, resp. response. e The CD8, TILs, and CYT scores of patients in the FUSCC cohort with different levels of genetic ITH. f Schematic overview of the analytical workflow. Four clinical trials were used to document the relationship between pretreatment ITH and anti-PD-1 responses in TNBC. Scale bar, 60 μm. g–i Analysis of the responses in patients with different levels of histologic ITH in NCT04613674 (g), NCT04418154 (h) and NCT03805399 (i). j Analysis of the response, PFS and OS in patients with different levels of histologic ITH in NCT04129996. P values were determined using log-rank tests (b, c, j), Wilcoxon tests (e), and Fisher’s exact tests (g–j). *P < 0.05, **P < 0.01.

