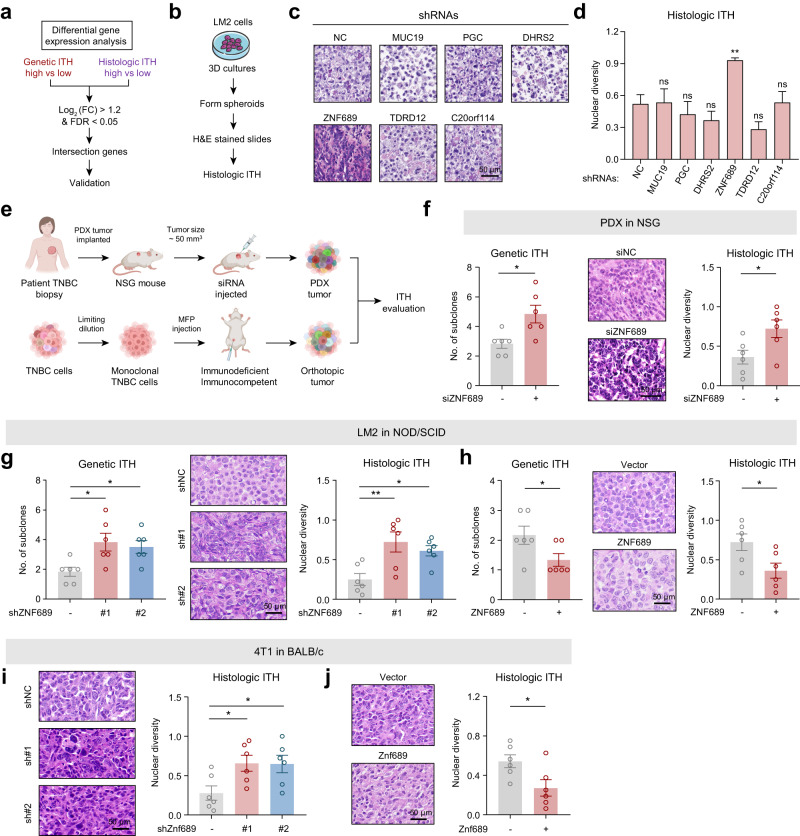
Fig. 2. ZNF689 deficiency promotes ITH in TNBC.
a Flowchart of the screening process. FC fold change; FDR false discovery rate. b Protocols of the 3D tumor sphere assay to evaluate the histologic ITH of LM2 cells. c Representative images of H&E-stained LM2 spheroids. d Histologic ITH analysis of LM2 spheroids. e Graphic illustration of different mouse models to examine the role of ZNF689 in ITH. f The genetic ITH and histologic ITH of TNBC PDX tumors from NSG mice (n = 6) after intratumoral administration with either siNC or siZNF689. g The genetic ITH and histologic ITH of orthotopic tumors generated by inoculating NOD/SCID mice (n = 6) in the MFPs with shNC or shZNF689 LM2 cells. h The genetic ITH and histologic ITH of orthotopic tumors generated by inoculating NOD/SCID mice (n = 6) in the MFPs with vector- or ZNF689-overexpressing LM2 cells. i Histologic ITH of orthotopic tumors generated by injecting shNC or shZnf689 4T1 cells into the MFPs of BALB/c mice (n = 6). j Histologic ITH of orthotopic tumors generated by injecting vector- or Znf689-overexpressing 4T1 cells into the MFPs of BALB/c mice (n = 6). Scale bars, 50 μm. P values were determined using one-way ANOVA (d, g, i) and two-tailed unpaired Student’s t-tests (f, h, j). ns not significant; *P < 0.05, **P < 0.01.

