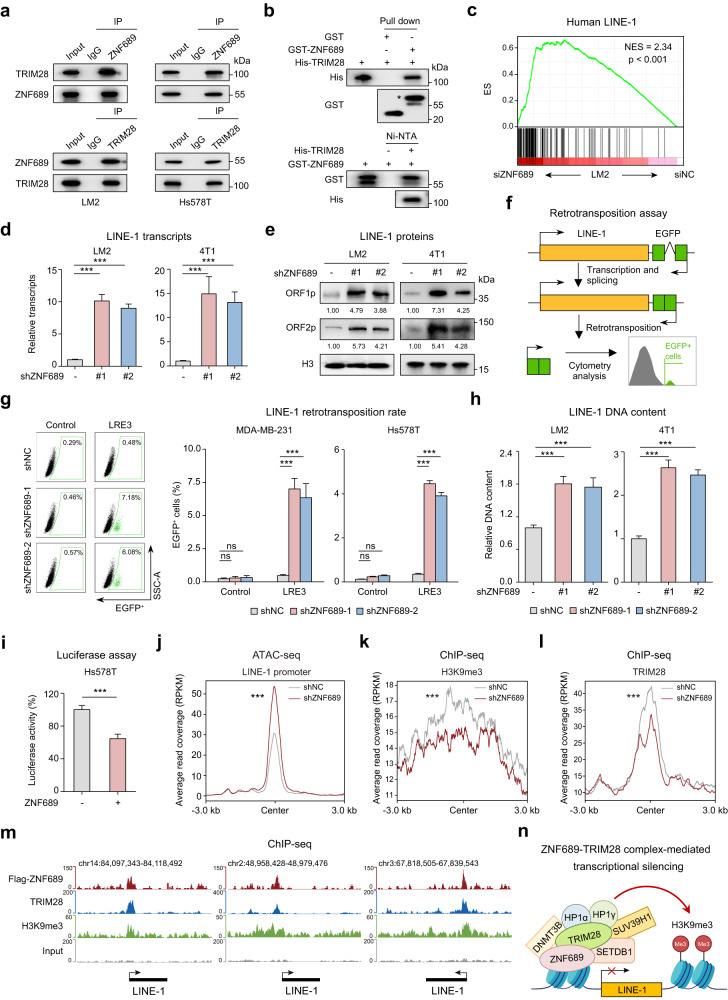
Fig. 3. ZNF689 represses LINE-1 retrotransposition via TRIM28 complex-mediated transcriptional silencing.
a Co-IP experiments of endogenous ZNF689 and TRIM28 followed by western blotting. b In vitro pull-down assays of GST-tagged ZNF689 and His-tagged TRIM28 recombinant proteins followed by western blotting. A single asterisk represents the specific band. c Upregulation of the human LINE-1 gene signature in siZNF689-treated LM2 cells by GSEA. d RT-qPCR analysis of LINE-1 (ORF2) transcript levels in shNC and shZNF689 cells. e Western blot analysis of LINE-1 ORF1p and ORF2p proteins in shNC and shZNF689 cells. f Schematic illustration of the LINE-1 retrotransposition reporter assay. g Representative flow cytometry graphs are shown for cells harboring the LRE3-EGFP retrotransposition reporter or the retrotransposition-deficient JM111 control (left). Quantification of de novo retrotransposition events (EGFP-positive cells) in shNC and shZNF689 cells (right). h RT-qPCR analysis of the relative LINE-1 (5′-UTR for LM2; ORF2 for 4T1) genomic DNA content in shNC and shZNF689 cells. i Dual-luciferase reporter assay detecting the activity of the LINE-1 promoter in ZNF689-overexpressing cells. j ATAC-seq peak signals affected by ZNF689 knockdown at the full-length LINE-1 promoter in LM2 cells. k, l Metaplots showing changes in H3K9me3 (k) and TRIM28 (l) ChIP-seq signals upon ZNF689 knockdown in the full-length LINE-1 promoter. m ChIP-seq tracks showing the binding patterns of ZNF689, TRIM28, H3K9me3 and input at full-length LINE-1. n Schematic diagram showing that ZNF689 represses LINE-1 retrotransposition via TRIM28 complex-mediated transcriptional silencing. P values were determined using one-way ANOVA (d, g, h), two-tailed unpaired Student’s t-tests (i) and Wilcoxon tests (j–l). ns not significant; ***P < 0.001.

