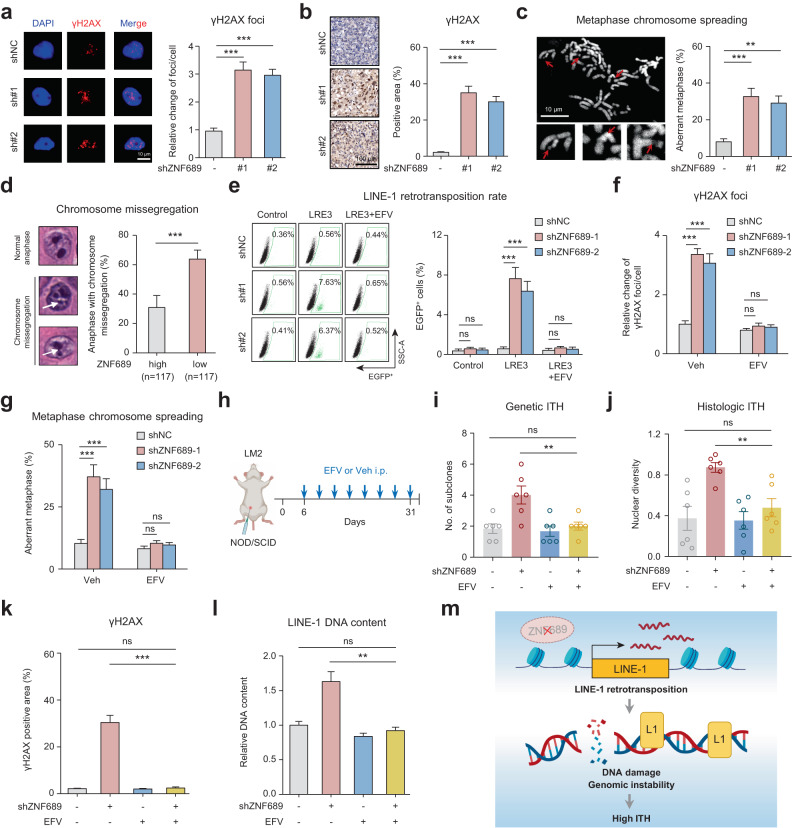
Fig. 4. ZNF689 deficiency-induced LINE-1 retrotransposition exacerbates genomic instability and promotes ITH.
a Representative IF images and quantification of γH2AX foci in shNC and shZNF689 LM2 cells (n = 30). Scale bar, 10 μm. b Representative IHC images and quantification of γH2AX in orthotopic shNC and shZNF689 LM2 tumors (n = 6). Scale bar, 100 μm. c Representative images and quantification of chromosome aberrations (red arrows) in shNC and shZNF689 LM2 cells at passage 20 (n = 50). Scale bar, 10 μm. d Representative images and quantification of chromosome missegregation errors (white arrows) in diagnostic H&E samples in the FUSCC cohort. e Representative flow cytometry graphs and quantification of de novo retrotransposition events (EGFP-positive cells) in shNC and shZNF689 MDA-MB-231 cells treated with EFV (20 μM). f Quantification of γH2AX foci in shNC and shZNF689 LM2 cells treated with EFV (20 μM) (n = 30). g Quantification of chromosome aberrations in shNC and shZNF689 LM2 cells at passage 20 treated with EFV (20 μM) (n = 50). h Schematic diagram of the EFV treatment regimen. After inoculation of shNC or shZNF689 LM2 cells into the MFP, the NOD/SCID mice were randomly divided into groups and treated daily with Veh or EFV via i.p. injection (n = 6 mice/group). i, j The genetic ITH (i) and histologic ITH (j) of orthotopic LM2 tumors from mice in h (n = 6). k Quantification of γH2AX in orthotopic tumors from mice in h (n = 6). l RT-qPCR analysis of LINE-1 (5′-UTR) DNA content of tumors dissected from mice in h (n = 6). m Schematic diagram showing that ZNF689 deficiency exacerbates genomic instability to promote ITH by reactivating LINE-1 retrotransposition. P values were determined using one-way ANOVA (a–c, e–g, i–l) and two-tailed unpaired Student’s t-tests (d). ns not significant; **P < 0.01, ***P < 0.001.

