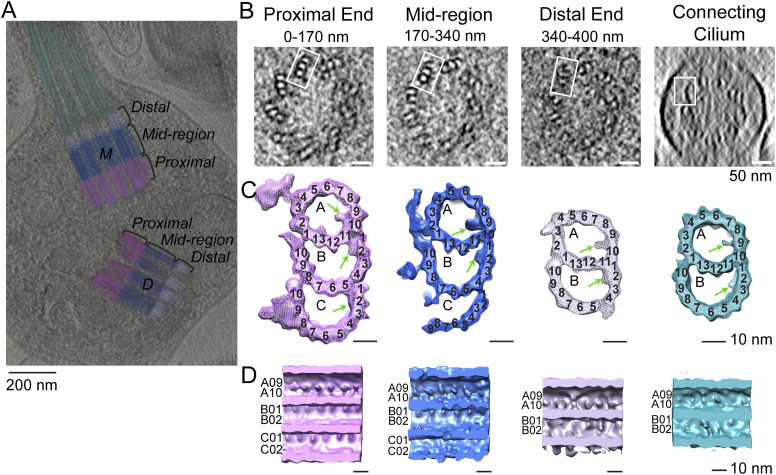
Figure 1. Tomographic reconstruction and subtomogram averaging of three structural domains from mouse centrioles.
(A) Slice from a reconstructed tomogram showing mother and daughter centrioles (denoted as “M” and “D”). Centrioles were partitioned longitudinally into three regions, the proximal end (0–170 nm, light magenta) consisting of MT triplets, the mid-region (170–340 nm, blue) consisting of incomplete triplets, and the distal end (340–400 nm, light violet) consisting of MT doublets. The extending CC doublets are denoted in cyan. (B) Slices of a tomogram of a daughter centriole through the three centriole regions and the CC (from a different part of the tomogram). White boxes indicate examples of approximate regions used for initial stages of subtomogram averaging and refinement. (C) Four maps were generated by averaging tomogram subvolumes in each region of centrioles and of the CC. The A-, B-, and C-tubules, including non-tubulin densities, are shown, with protofilament numbering. Microtubule inner proteins are shown with green arrows. (D) Maps in C cut in half and rotated 90° toward the viewer to show microtubule inner proteins.

