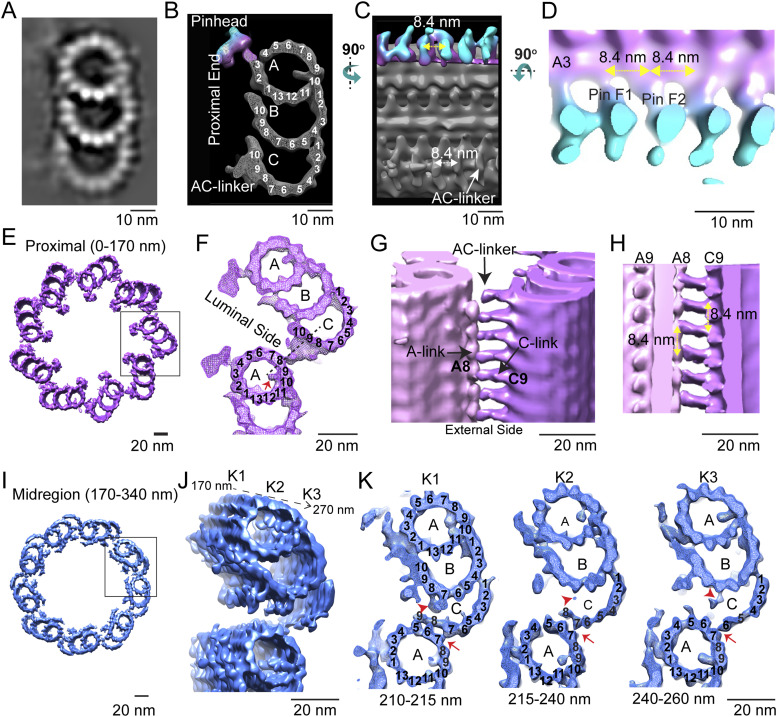
Figure 4. Pinhead and A-C linker in the proximal and mid-regions of the centriole.
(A, B) Projection view and (B) surface view (with surface capping) of the section through the microtubule triplet (MTT) map obtained from subtomogram averaging of complete MTTs in the proximal region (0–170 nm) viewed down the long axis of the MTT. (B, C) Surface rendering from (B) rotated 90° to reveal the side facing the lumen of the MT bundle. The pinheads are colored with depth-coding (magenta closer to MT, cyan furthest from the MT surface). (C, D) is a magnified and rotated version of the rendering in (C), highlighting the PinF1 and PinF2 feet of the pinhead and their 8.4-nm spacing. (E) Surface rendering of the centriole model in the proximal region of the mother centriole (0–170 nm) (from Fig 2B). (E, F) Magnified view of the boxed area in (E). The A-C linker is the density that links PF A8 on the A MT at the bottom to PF C9 of the adjacent C MT of the MTT at the top. (G) Side view from the outside of the MT bundle highlighting the A-C linkers. (F, H) Cutaway view (the cutting plane is shown as a dotted line in (F)) from the lumen of the MT bundle with yellow arrows highlighting the 8.4-nm spacing of the A-C linkers. (I, J, K) Mid-region (170–340 nm) of the compete centriole model showing the incomplete MTTs; the proximal 100 nm of the boxed region is shown at a higher magnification in (J, K). (J) is a tilted version showing the progression of structural changes along the centriole axis. (J, K) shows cross-sectional views of three different subregions (K1–K3) extracted at different levels from the map as shown in (J). Red arrows and arrowheads indicate the variations in the connections between A MT and C MT along the axis.

