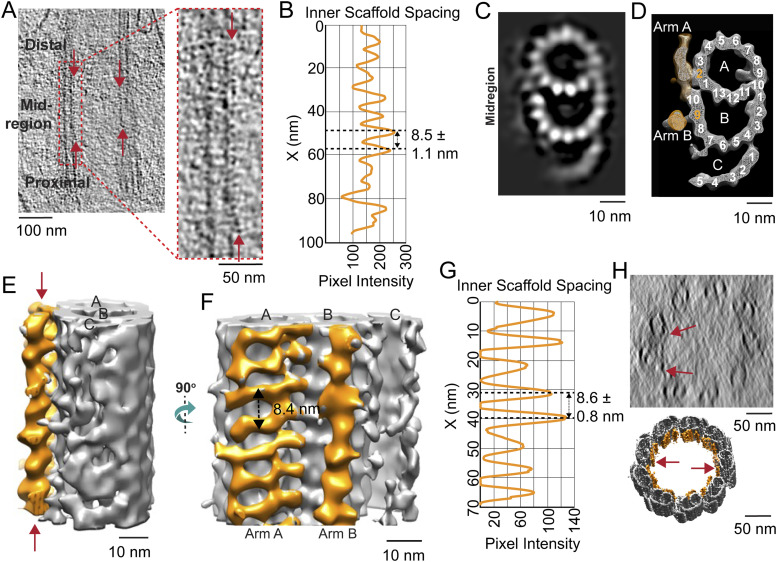
Figure 5. Inner scaffold along the incomplete triplets in the mid-region of the basal body.
(A) Section from raw cryo-electron tomogram of the rod photoreceptor showing the basal body structure in a longitudinal view with labels for the proximal, mid-region, and distal positions along the BB. The red arrows around the mid-region indicate the visible inner scaffold densities attached to the MTs. A zoomed-in view of inner scaffold densities attached to microtubule triplets (as indicated with a dashed red box) is shown to the right. (B) Corresponding line intensity profile (right) of the inner scaffold showing an average periodicity in the mid-region of 8.5 nm. (B, C, D) Cross sections of the BB mid-region map from subtomogram averaging in a projection view (B) or a surface view with surface capping (D). These reveal the complete A- and B-, and partial C-tubules. In panel (D), the extending filamentous densities from the lumen side of PF A2 (Arm A) and PF B9 (Arm B) are highlighted in orange. (C, D, E, F) Longitudinal views of the same region as in (C, D), with the inner scaffold shown in orange bracketed by red arrows in (E). (E) View in (F) is of the map shown in (E) rotated 90° toward the viewer. (F, G) Line intensity profile along the direction indicated by the double-headed arrow in (F) is shown in panel (G) (periodicity of 8.6 nm). (H) Cross-sectional view of a section of a raw tomogram in the BB mid-region with red arrows indicating the presence of inner scaffold (top) and a slightly tilted view of the corresponding region of the model from Fig 2B highlighting the inner scaffold indicated in orange (bottom).

