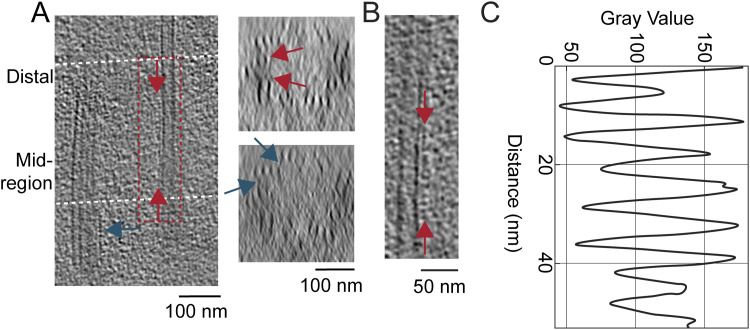
Figure S3. Visualization of the connections between microtubule triplets (by a A-C linker) and microtubule doublets (by an inner scaffold) in raw tomograms.
(A) Section through a raw tomogram generated by cryo-ET of centrioles showing the entire structure in a longitudinal view. Dashed lines indicate the positions of the cross sections shown to the right. (A, B, C) Arrows indicate the visible inner scaffolding in microtubule doublets (red arrows) and (A, B, C) the linker connecting the microtubule triplet in the proximal region (blue arrows).

