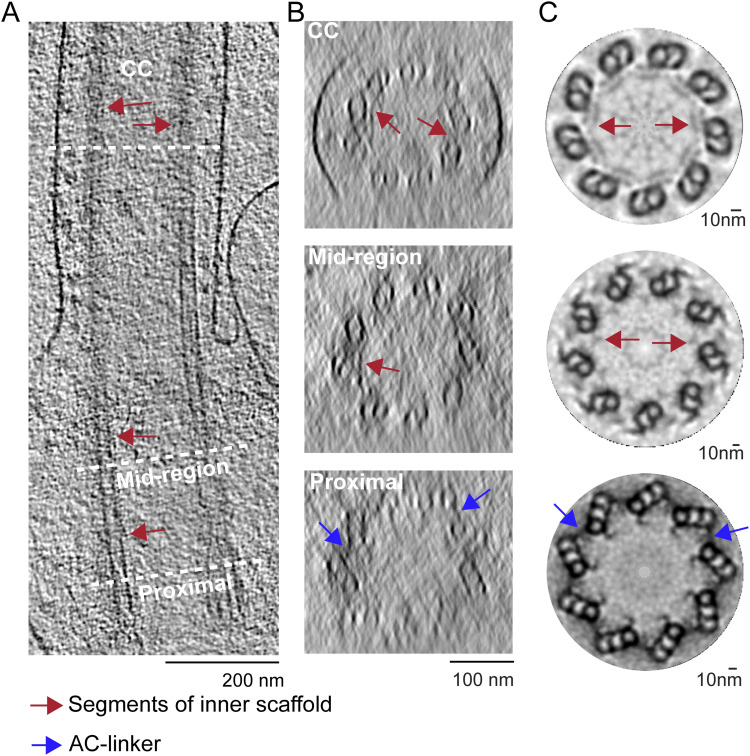
Figure S4. Visualization of the inner scaffold through the centriole and CC.
(A, B) Longitudinal section of a raw cryo-electron tomogram. Dashed lines indicate the positions of the cross sections in (B). (B, C) Cross sections from the three regions along the centriole and CC length, (B) before and (C) after ninefold symmetry averaging. Arrows show the inner scaffold partially attached to the doublets (red arrows) and the A-C linker within adjacent triplets (blue arrows).

