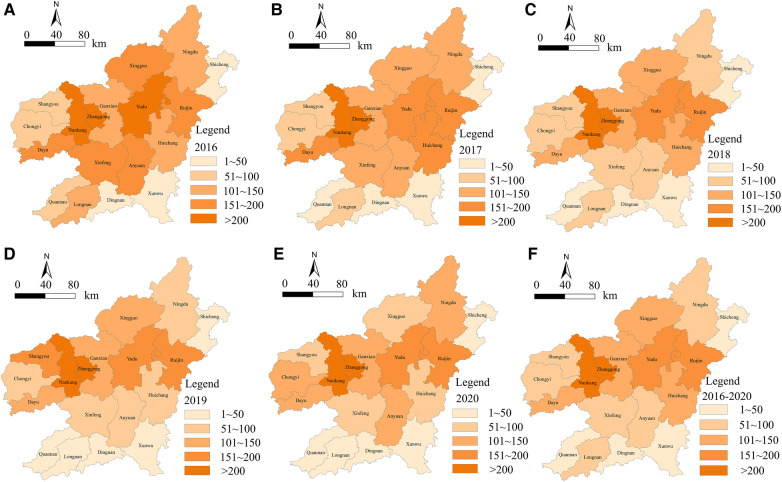
Figure 1.
Grade map of cumulative hospitalization rate of CVD cases in Ganzhou from 2016 to 2020. Figures (A–F) are based on the data of cardiovascular inpatients in a big data center of a 3A hospital in Ganzhou. The natural segment method of arcgis, a spatial statistical analysis software, is used to visually express the inpatient rate of cardiovascular diseases in Ganzhou from 2016 to 2020, which is divided into five grades, of which the first grade is 1–50 people. The second level is 50–100 people; The third level is 100–150 people; The fourth level is 150–200 people; The fifth grade is >200 people, in which the darker the color in the picture means more hospitalized patients, and the lighter the color means fewer hospitalized patients.

