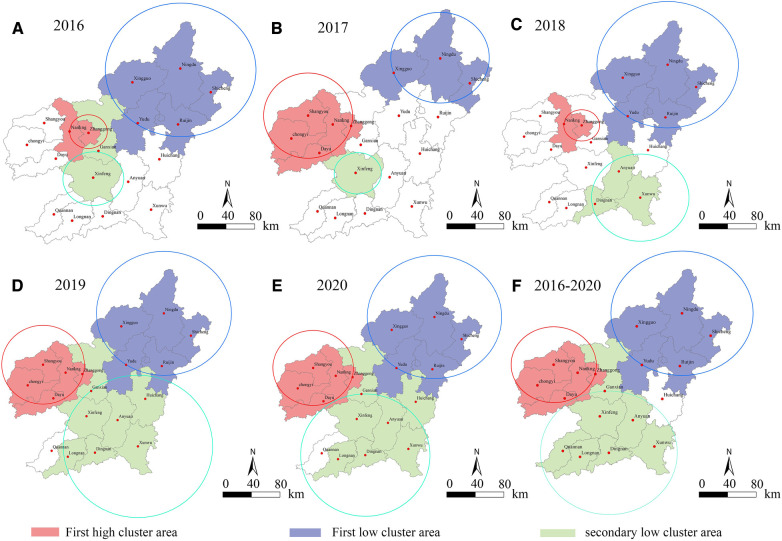
Figure 3.
Spatial-temporal scanning analysis chart of inpatients with CVD in Ganzhou from 2016 to 2020. Figures (A–F) are based on the data of cardiovascular inpatients in a big data center of a 3A hospital in Ganzhou. Taking P < 0.01 as the criterion of significance level, the medical records of cardiovascular inpatients in Ganzhou from 2016 to 2020 were scanned and analyzed by using Sat Scan software. Results Three different types of significant agglomeration areas were scanned in space, namely, one kind of high risk, one kind of low risk and two kinds of low risk. Red, purple and green in the figure were marked as different area types, and the circles with corresponding colors indicated the spatial coverage of different area types.

