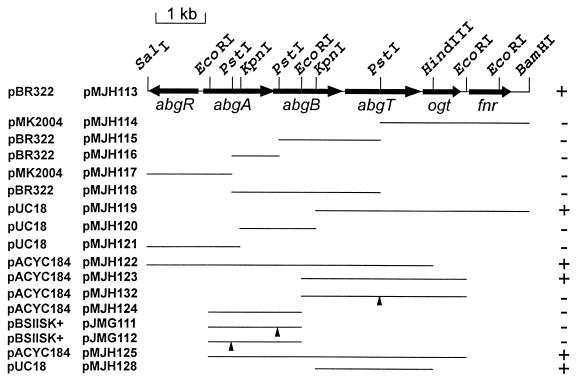
FIG. 3.
Map of the 7,266-bp region of the E. coli chromosome from bp 1,396,431 to bp 1,403,697, shown in the inverse orientation. Restriction sites used for subcloning purposes are illustrated, as are the extents of known reading frames. DNA fragments used in this study to localize abgT and to construct interruptions in abg genes are illustrated, and the vectors in which they are cloned are indicated. The vector names (leftmost column) and plasmid names are shown to the left of the map. Triangles denote the positions of kanamycin resistance cassette insertions. The ability of each plasmid to confer p-aminobenzoyl-glutamate utilization is indicated at the right.

