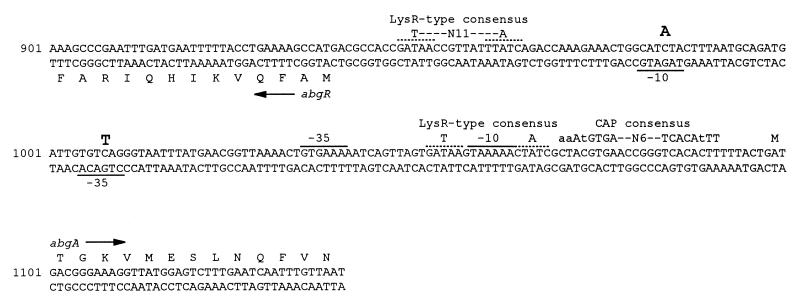
FIG. 4.
Nucleotide and amino acid sequences of the abgR-abgA intercistronic region. The positions of mutations resulting in the p-aminobenzoyl-glutamate utilization phenotype are shown in large bold letters above the sequence. Putative LysR-type protein-binding sequences are shown as dotted lines above the sequence. Putative −10 and −35 sequences of the abgR and abgA promoters are overlined or underlined. The CAP consensus sequence is also indicated above the sequence (lowercase letters indicate nucleotides that are not as strongly conserved as the capitalized nucleotides). Numbering is from the SalI site prior to abgR.

