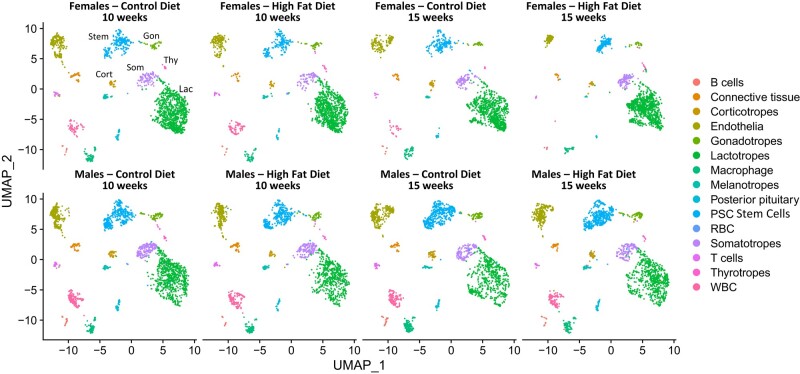
Figure 5.
Single cell RNA-Seq UMAP plots showing that we were able to detect near-neighbor clusters representing all major pituitary cell types. Cells were clustered based on the detection of a common set of transcripts which represented the consensus for each cell type (Table S1 shows the top 10 genes expressed for each cluster). A comparison of these plots shows a similar distribution comparing males and females and time on the diet for each sex.

