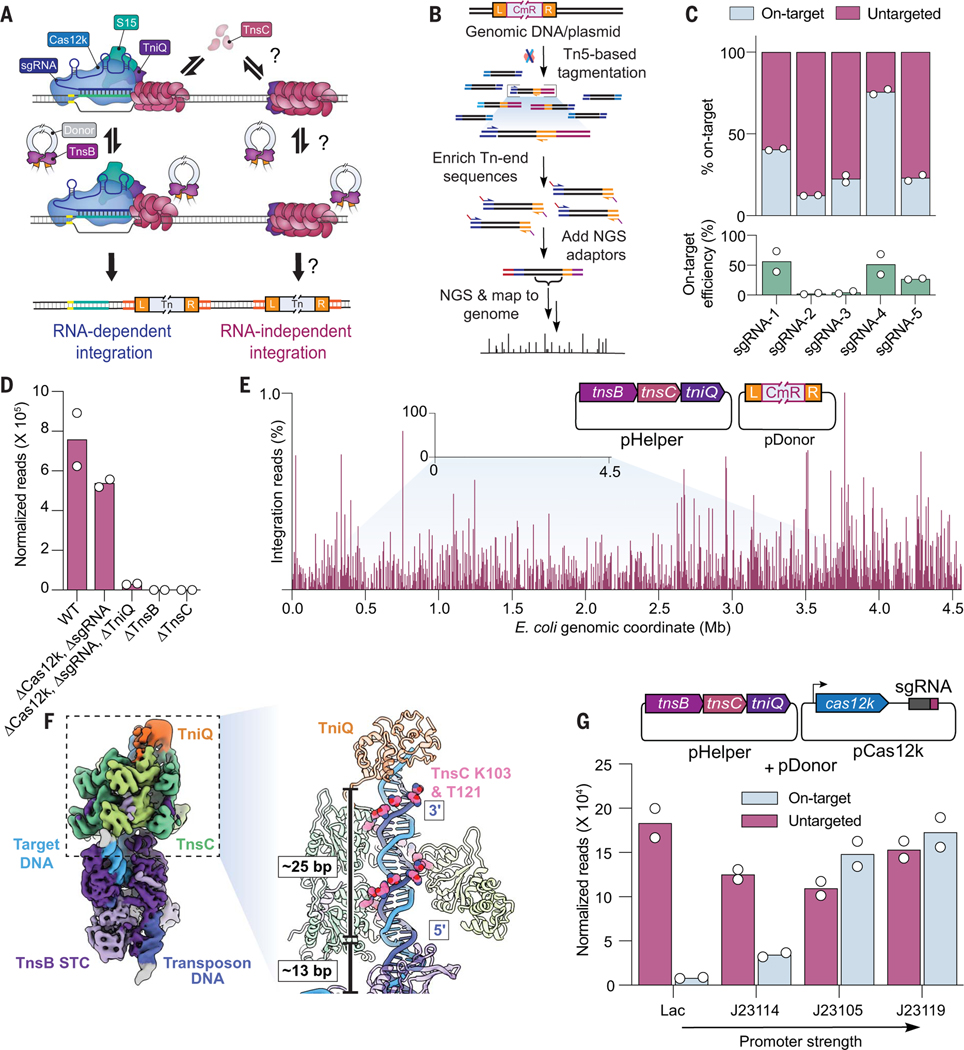
Fig. 1. Type V-K CASTs direct frequent Cas12k- and RNA-independent transposition events.
(A) Schematic of type V-K CAST transposition occurring at on-target sites (RNA-dependent) and untargeted sites (RNA-independent). (B) Experimental TagTn-seq pipeline used for in vitro and genomic samples. (C) Fraction of total genome-mapping integration reads detected at on-target and untargeted sites for the WT pHelper expression plasmid across multiple sgRNAs (top), plotted above on-target transposition efficiencies for the same sgRNAs as measured by Taqman qPCR (bottom). (D) Total genome-mapping reads detected for WT pHelper or pHelper with the indicated deletions, normalized and scaled. (E) Magnified view of integration reads comprising ≤1% of E. coli genome-mapping reads in an experiment performed without Cas12k and guide RNA. (F) Cryo-EM reconstruction of the untargeted transpososome revealing the assembly of TniQ (orange), TnsC (green), and TnsB (purple) in a strand-transfer complex (STC). The target DNA and transposon DNA are represented in light blue and dark blue, respectively. For visualization, a composite map was generated using two local resolution-filtered reconstructions from the focused refinements. Magnified and cutaway views show TnsC forming a helical assembly on the target DNA, positioning residues K103 and T121 (pink) adjacent to one strand of the target DNA (dark blue). The 5′ and 3′ ends of the TnsC-interacting DNA strand are indicated. Two turns of TnsC and TnsB footprint on DNA until TSD cover ~25 and 13 bp, respectively. Only selected TnsC monomers are represented in the cutaway for clarity. (G) Cas12k and the sgRNA were cloned onto a separate vector, and the promoter driving Cas12k expression was varied. Reads detected at on-target and untargeted sites during transposition assays were normalized and scaled. For (C), (D), (E), and (G), the mean is shown from N = 2 independent biological replicates.

