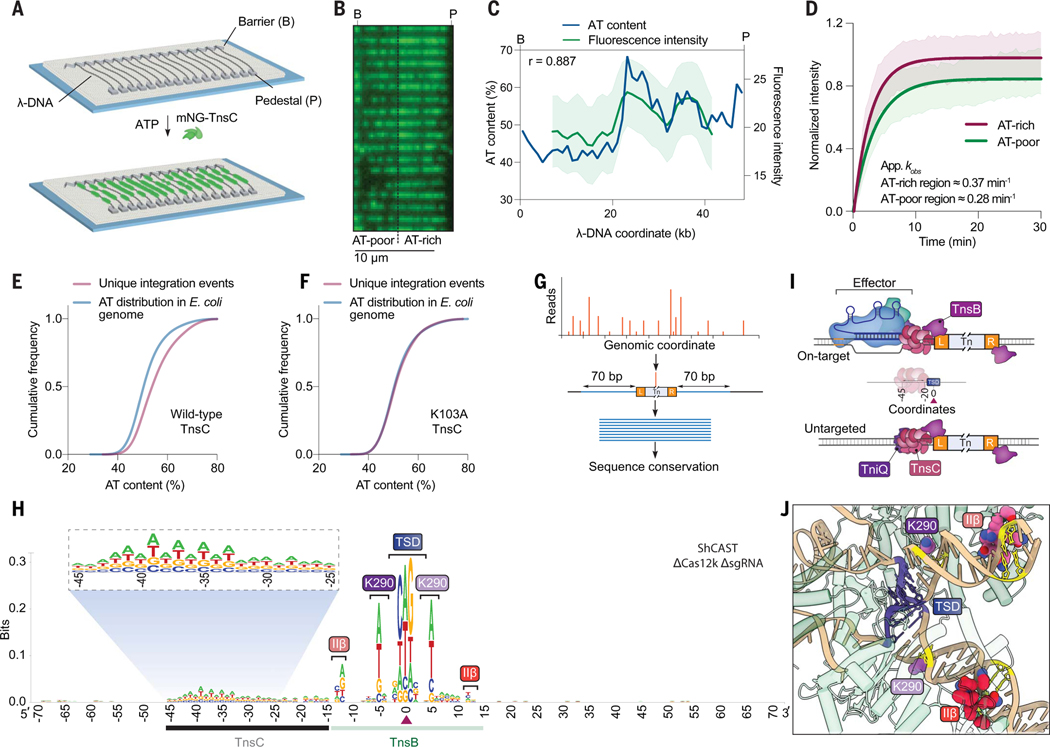
Fig. 3. RNA-independent integration events occur at preferred sequence motifs.
(A) Schematic for single-molecule DNA curtains assay to visualize TnsC binding. λ-phage DNA substrates are double-tethered between chrome pedestals and visualized used total internal reflection fluorescence microscopy. (B) mNG-labeled TnsC preferentially binds AT-rich sequences on the λ-DNA substrate near the 3′ (pedestal) end (movie S1). (C) Correlation between AT content and mNG-TnsC fluorescence intensity visualized along the length of λ-DNA. The Pearson linear correlation coefficient is shown (two-tailed P < 0.0001). Data are shown as mean ± SD for N = 66 molecules. (D) Binding kinetics for mNG-TnsC at AT-rich and AT-poor regions of the λ-DNA substrate. Apparent kobs at AT-rich sites ≈0.37 min−1, 95% confidence interval (CI) = 0.35 to 0.39, and at AT-poor sites ≈0.28 min−1, 95% CI = 0.27 to 0.30. Data are shown as mean ± SD for N = 87 molecules (thick line, shaded region). Binding kinetics for AT- and GC-rich sites when compared gave a P value of 0.017 upon bootstrapping. (E) Cumulative frequency distributions for the AT content within a 100-bp window flanking integration events using ShCAST with WT TnsC and sgRNA-1 (N = 5505 unique integration events), compared with random sampling of the E. coli genome (N = 50,000 counts). The distributions were significantly different on the basis of results of a Mann-Whitney U test (P = 1.48 × 10−135). (F) Cumulative frequency distribution comparison as in (E) but with a K103A TnsC mutant (N = 1932 unique integration events), which revealed a loss of AT bias (P = 0.1349). (G) Meta-analysis of untargeted transposition specificity was performed by extracting sequences from a 140-bp window flanking the integration site and generating a consensus logo. (H) WebLogo from a meta-analysis of untargeted genomic transposition (N = 5855 unique integration events) with a modified pHelper lacking Cas12k and sgRNA. The site of integration is noted with a maroon triangle. An AT-rich sequence spanning ~25 bp likely reflects the footprint of two turns of a TnsC filament (black), whereas motifs within/near the TSD represent TnsB-specific sequence motifs (green). Specific TnsB residues and domains contacting the indicated nucleotides are shown. The magnified inset highlights periodicity in the sequence bound by TnsC. (I) Schematic showing the relative spacing of sequence features bound by Cas12k, TnsC, and TnsB in both on-target (RNA-dependent) and untargeted (RNA-independent) DNA transposition. In both cases, the TnsC footprint covers ~25 bp of DNA and directs polarized, unidirectional integration downstream in a L-R orientation. (J) Magnified view of the ShCAST transpososome structure highlighting sequence-specific contacts between TnsB and the target DNA observed in (H). The Protein Data Bank identification number is 8EA3 (23).

