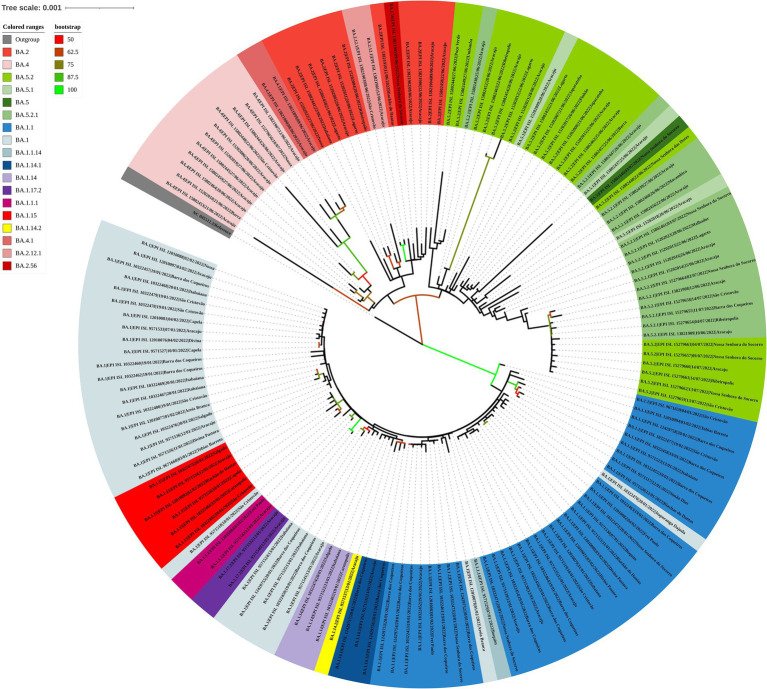
Figure 10.
Maximum likelihood tree of 150 SARS-CoV-2 whole-genome sequences available at the GISAID database using the TIM + F + I + I + R3 evolutive model. The colors assigned to the branches are related to their respective lineages and the samples are labeled according to their sampling dates and virus lineages.

