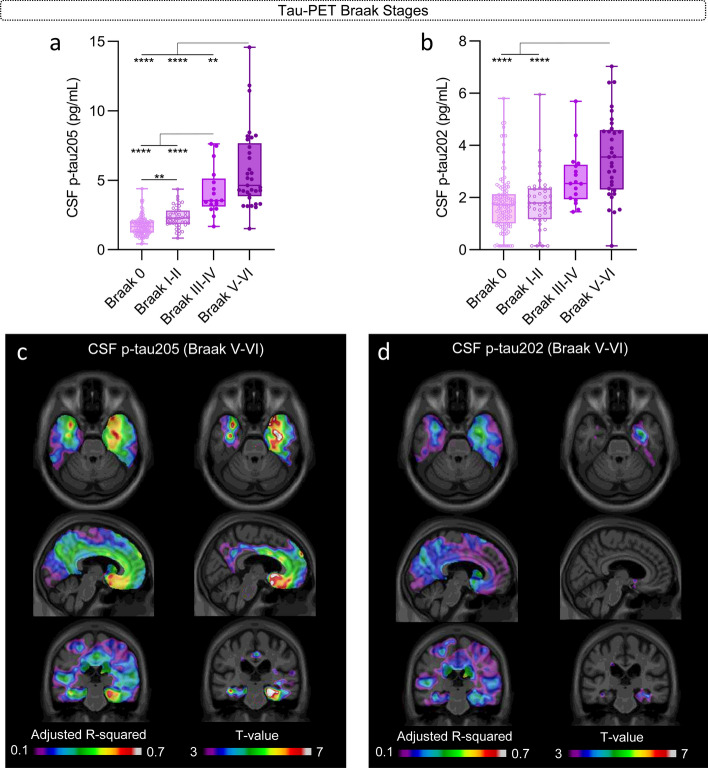
Fig. 5.
CSF p-tau205 and p-tau202 concentrations across tau-PET Braak stages and regional association with tau-PET Braak V-VI. a CSF p-tau205 increased progressively across tau-PET Braak stages, whereas b CSF p-tau202 was only increased in tau-PET Braak V-VI individuals. Regional association between c CSF p-tau205 and d CSF p-tau202 with tau-PET Braak V-VI participants. Data information: Boxplots show the median, IQR and all participants. P-values were determined using one-way ANOVA adjusted by age and sex, followed by Bonferroni-corrected post hoc comparison (*P < 0.05, **P < 0.01, ***P < 0.001, ****P < 0.0001). Voxel maps display the adjusted R-squared and t values of the linear associations between CSF biomarkers and [18F]MK6240 at Braak V-VI, adjusted by age and sex

