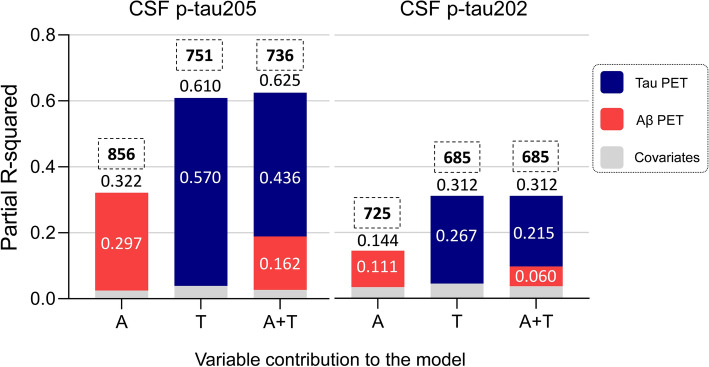
Fig. 6.
Proportion of variation in CSF p-tau205 and p-tau202 levels explained by Aβ and tau pathology measured by PET (TRIAD cohort). The performance of three regression models (Aβ-PET: A, tau-PET: T, Aβ and tau-PET: A+T) predicting CSF p-tau205 and p-tau202 concentrations was evaluated. The best model predicting the variation in the concentration of CSF p-tau205 was A+T, whereas for CSF p-tau202 it was T. Data information: Each bar plot represents one model. Independent variables included Aβ-PET (A, in red) and tau-PET (T in blue). All models include age and sex as covariates (represented in grey). AIC of each model is displayed on top of each bar plot, within a dashed square. R-squared values for each model are displayed on top of the respective bar plot, whereas the partial R-squared of each variable within the model is presented inside the bar plot

