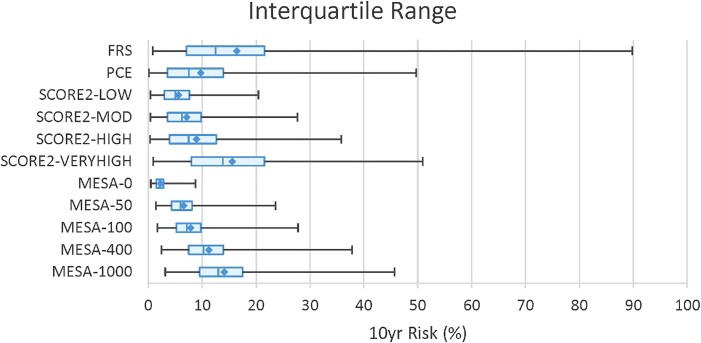
Figure 1.
Ten-year event rate calculations for the different algorithms. Diamonds designate the mean % events per decade. The blue box and the vertical hash mark within represent the second to third interquartile range and the median value, respectively. FRS, PCE, SCORE2, and MESA as previously defined. LOW, MOD (moderate), HIGH, and VERY HIGH indicate the geographical risk regions as previously defined. 0, 50, 100, 400, and 1000 indicate the assigned Agatston Units required for the MESA algorithm.

