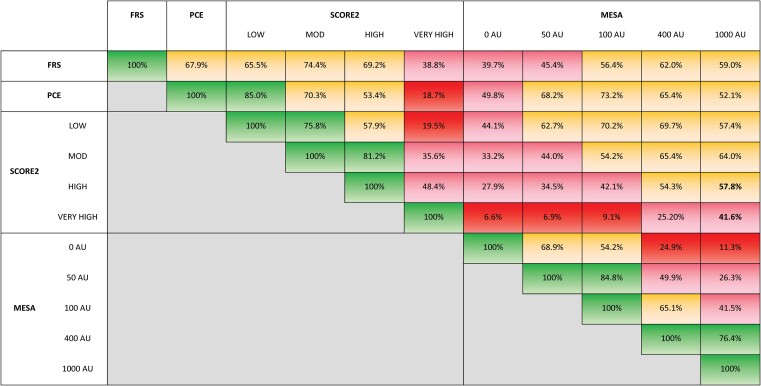
Figure 2.
Overall concordance rates for stratification into low, moderate, and high risk categories using the different algorithms. For SCORE2, results are shown using the LOW, MOD (moderate), HIGH, and VERY HIGH risk geographical algorithms. For MESA, simulations assigning Agatston Units (AU) of 0, 50, 100, 400, and 1000 are shown. Concordance rates: green (>75%–100%), yellow (>50%–75%), pink (>25%–50%), and red (0%–25%).

