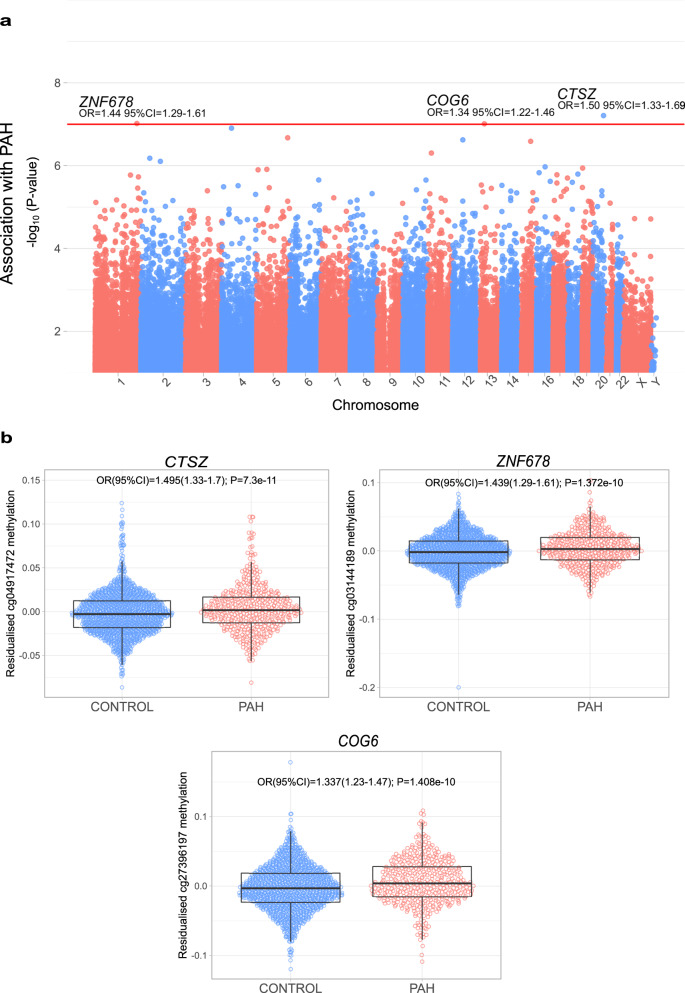
Fig. 2. Epigenome-wide association study (EWAS) of PAH.
a Manhattan plot of EWAS of PAH. DNAme markers are ordered according to their genomic positions along the x-axis. Inflation-adjusted P-values for the CpG marker effect are plotted along the y-axis on the -log10 scale. The red horizontal line corresponds to the epigenome-wide significance threshold of P < 10−7 with annotated markers reaching this threshold. b Methylation levels of the three PAH-associated DNAme markers in 429 individuals with PAH and 1226 controls. Residuals of CpG methylation levels after adjusting for covariates in the EWAS are plotted along the y-axis. Boxplots show the median, interquartile range (IQR) and whiskers extend to 1.5 times the IQR. PAH odds ratio (OR) and 95% confidence intervals from multivariable regression analyses are shown, with unadjusted p-values in b.

