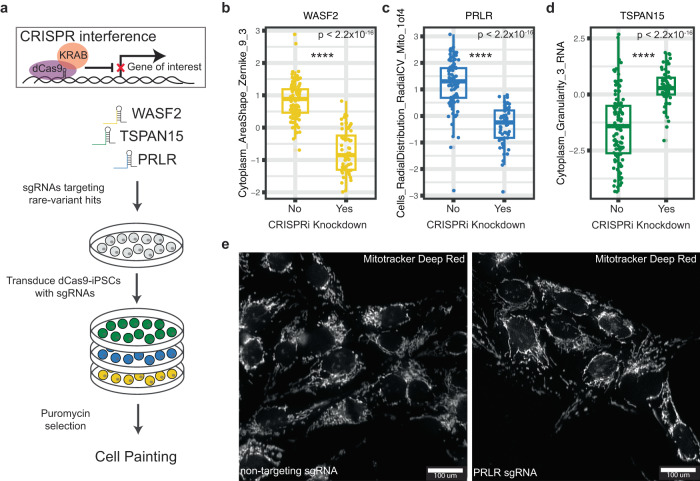
Fig. 4. Functional validation of rare-variant burden associations.
a Workflow for knockdown of rare-variant genes using CRISPR interference in iPSCs expressing constitutive dCas9-KRAB. b–d Box plots displaying quantification of traits between control non-targeting sgRNAs and sgRNAs targeting WASF2, TSPAN15, and PRLR on a per-well level (n = 52 wells per non-targeting sgRNAs, n = 56 wells per targeting sgRNAs, P < 2.2 × 10⁻¹⁶, Welch’s two-sided T test). Effect on the trait score is consistent with what we observed in our rare-variant burden association. Data is presented in a Tukey-style boxplot with the median (Q2) and the first and the second quartiles (Q2, Q3) and error bars defined by the last data point within ±1.5-times the interquartile range. e Representative image of an observable gene-trait association for PRLR. Cells_RadialDistribution_RadialCV_Mito_1of4 relates to the asymmetric distribution of mitochondria in the ring right around the nucleus. In the non-targeting controls (left) we observed clustering of mitochondria on a particular side of the nucleus, whereas in the PRLR knockdown sgRNA (right) we observed a more distributed presence of mitochondria around the nucleus.

