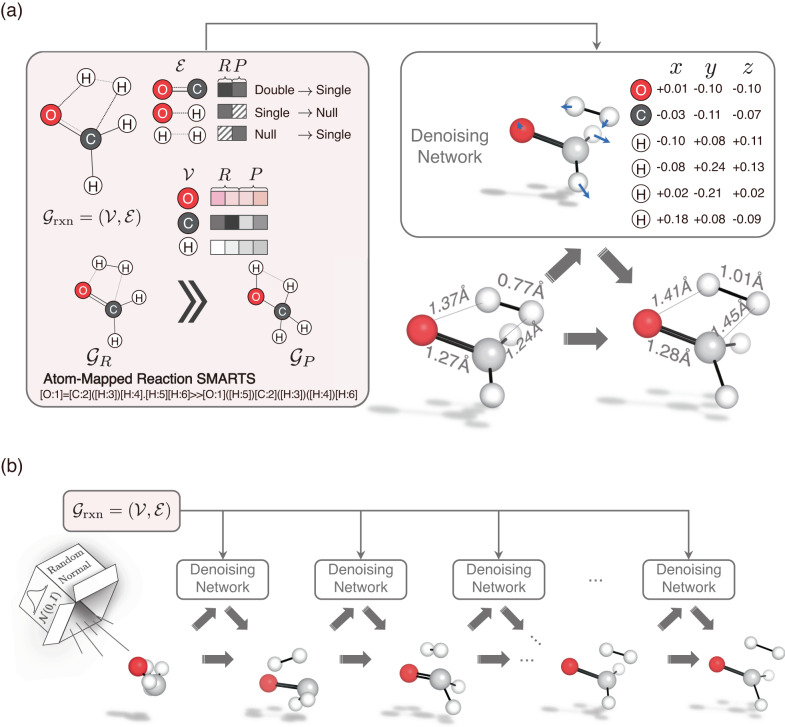
Fig. 1. Overview of the proposed TSDiff.
a Illustration of the reaction graph () and the denoising network. The molecular graphs of the reactants (R) and products (P), denoted and respectively, are constructed from the SMARTS representation of the reaction. Then, the condensed graph is formed using the node vectors () and edge vectors () obtained from them. The denoising network denoises a given geometry input based on . b Transition state (TS) generation procedure of the proposed TSDiff. Starting from a randomly initialized geometry, the geometry is progressively refined by the denoising network until reaching a predicted TS geometry. All molecular geometries were plotted using PyMOL71.

