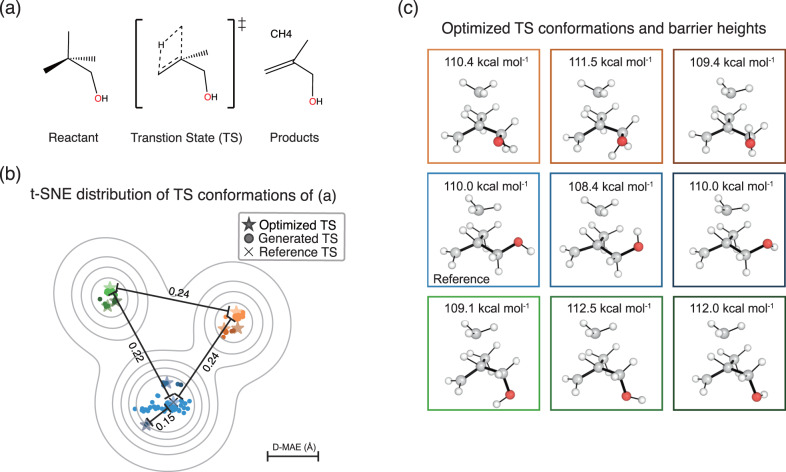
Fig. 4. Visualization of the geometries generated by TSDiff.
a A given chemical reaction to demonstrate the use of TSDiff. b Visualization of the distribution of transition state (TS) conformations of the given reaction, using the t-distributed stochastic neighbor embedding (t-SNE) method based on the interatomic distances of the geometries. The geometries generated by TSDiff and the optimized results for them are indicated by dots and star-shaped dots, respectively. The reference TSs in the dataset are marked with a cross. The four values in this plot indicate the mean absolute error of the interatomic distances (D–MAE) between the two selected dots. The contours were plotted using kernel density estimation on the t-SNE transformed results. c The geometries and barrier heights corresponding to the nine different TS conformations, represented by the star-shaped dots in (b) with the same color as the box edges. All molecular geometries were plotted using PyMOL71.

