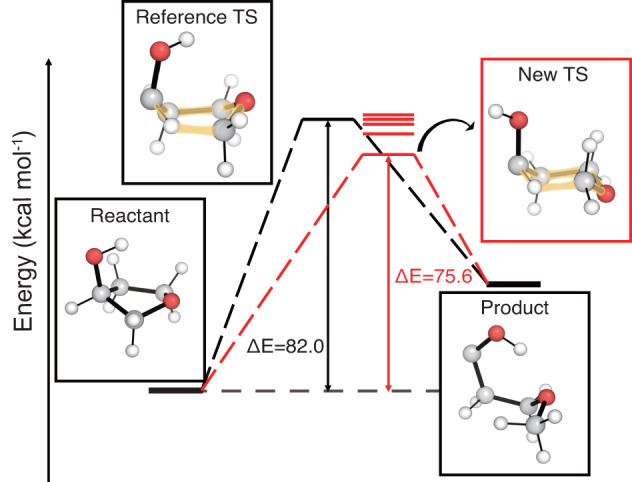
Fig. 6. Comparison of the barrier heights of the reference and those found by TSDiff.

The transition state (TS) conformations were obtained by saddle point optimization using the initial geometries generated by TSDiff, and their energy levels are shown as red lines. The geometries of the reference database are visualized in the black boxes, and the newly discovered TS conformation with the lowest energy is visualized in the red box. The barrier heights (ΔE) are compared for the reference TS and the new lowest energy TS. All molecular geometries were plotted using PyMOL71.
