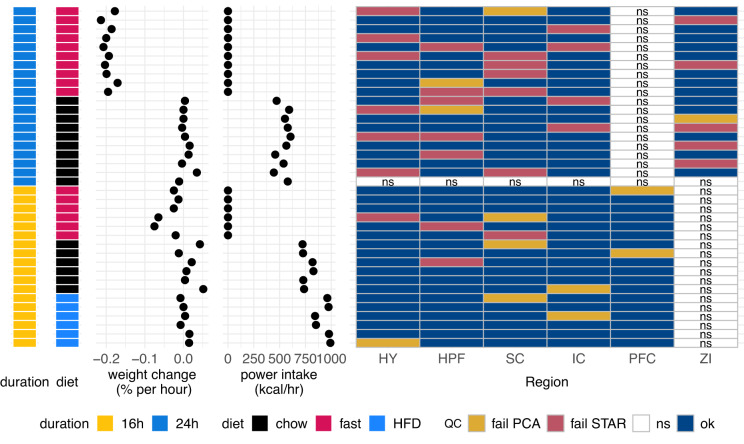
Fig. 2.
Summary of animal experiments and sequencing results. Each row represents a single animal, colour coded by study duration (yellow for 16 h and blue for 24 h). The next colour coded column represents the diet the animal was exposed to (black for chow, magenta for fasted, and blue for high-fat diet (HFD). The following dot plots show the change in body weight for each animal expressed in units of percent initial weight over duration of hours, and the energy intake per hour of each animal. The grid on the right represents the samples for each animal and their quality control (QC) status. Samples which were not sequenced (ns) are white. Additional abbreviations: h/hr, hour; HY, hypothalamus; HPF, hippocampus; SC, superior colliculus; IC, inferior colliculus; kcal, kilocalories; PFC, prefrontal cortex; QC, quality control; ZI, zona incerta.

