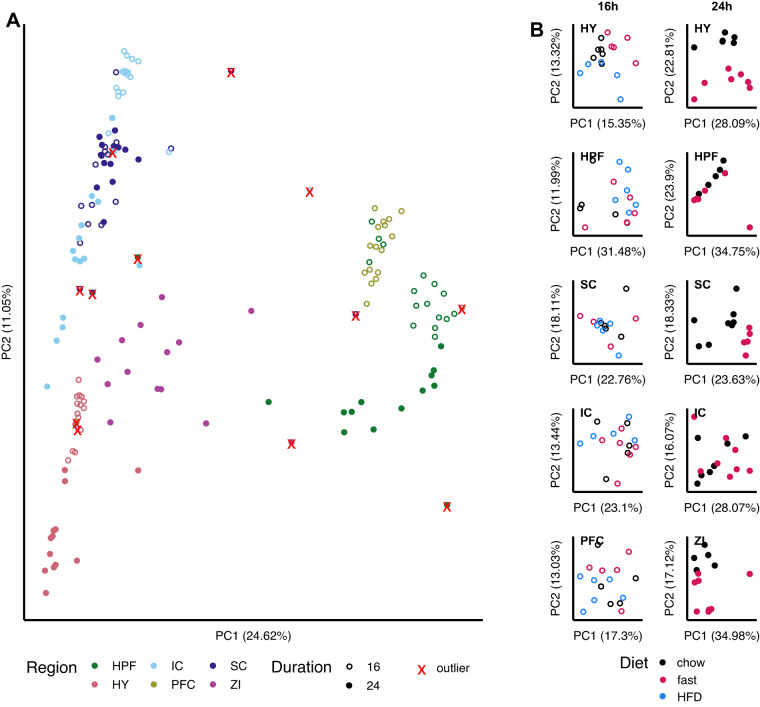
Fig. 4.
Gene expression profiling and PCA. (A) PCA of the VST transformed counts from samples across both studies and all regions. Open circles indicate samples which come from the 16 h study, closed circles indicate samples from the 24 h study. Xs mark samples which were flagged as outliers due to being more than 2 standard deviations away from the respective cluster of their region in either PC1 or PC2. (B) PCA performed only using the samples from each study and region, and excluding outliers from (A). Abbreviations: h, hour; HFD, high-fat diet; HY, hypothalamus; HPF, hippocampus; SC, superior colliculus; IC, inferior colliculus; PC, principal component; PFC, prefrontal cortex; ZI, zona incerta.

