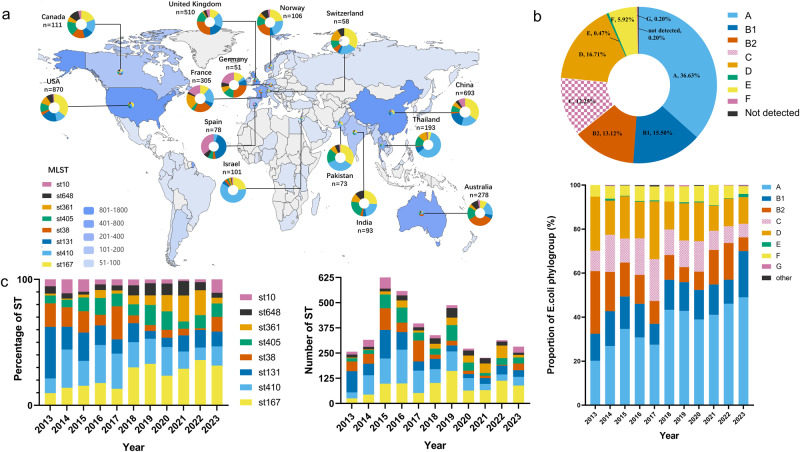
Fig. 2. The prevailing Sequence Types (STs) and phylogroups among 7918 CRECs exhibit global spatial and temporal patterns.
a The map’s color scheme represents the number of CRECs, while the pie charts for each country offer an overview of the global distribution of the most prevalent STs of CRECs. b Pie charts visually represent the proportional distribution of different phylogroups within 7918 CRECs. Histograms are graphical representations that depict the percentage distribution of various phylogroups of CRECs between 2013 and 2023. c The histogram displays the chronological distribution of the most prevalent STs from 2013 to 2023.

