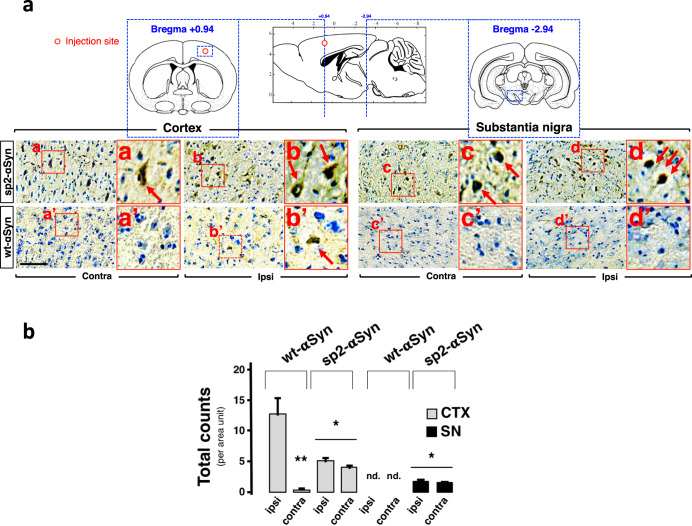
Fig. 5. αSyn spreading in the mammalian brain.
a Representative IHC images of coronal brain sections of cortex and substantia nigra of wild-type mice that received a single injection of an AAV9 encoding sp2- or wt-αSyn in the cortex. Animals were sacrificed at 4 months post-surgery. In the upper part a schematic representation of the anatomical structures analyzed that includes approximate rostro-caudal coordinates with the bregma as reference. Quantification is shown in (b). Data is shown as total counts per area unit ± SD. Contralateral (Contra) and ipsilateral (Ipsi) hemispheres are shown. Scale bar: 200 μm. *p < 0.05 compared to wt-αSyn. **p < 0.05 compared to ipsi (one-way ANOVA followed by the post hoc Tukey’s test).

