
FIGURE 2.
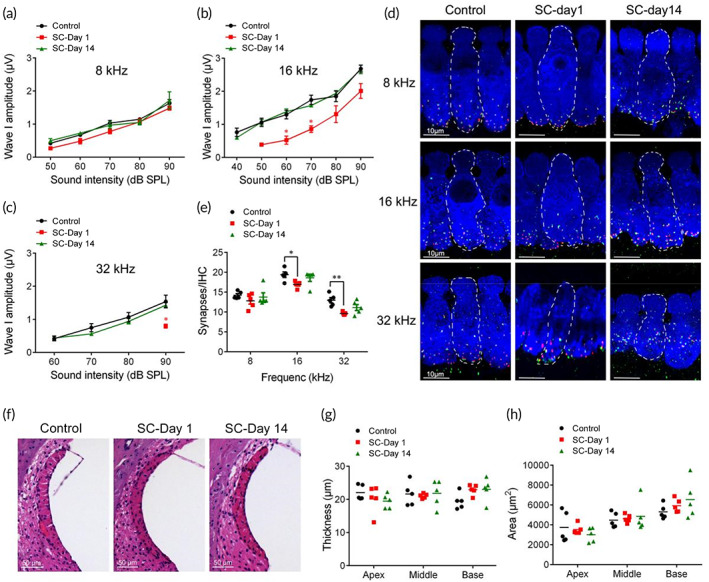
Safety evaluation of sound conditioning (SC). (a–c). Auditory brainstem response Wave‐I amplitudes of indicated frequencies (8, 16, and 32 kHz) in control, Days 1 and 14 post‐SC groups (n = 6). (d,e). Immunostaining and relative synaptic puncta counts for presynaptic ribbons (CtBP2, green), postsynaptic patches (GluA2, red), and inner hair cells (Myosin VIIa, blue) at 8, 16, and 32 kHz in control, Days 1 and 14 post‐SC groups (n = 5). (f). Representative images of SV in control, Days 1 and 14 post‐SC groups (n = 5). (g,h). Histological examinations of area and thickness of SV (n = 5). *p < 0.05, **p < 0.01 versus Control.