
FIGURE 3.
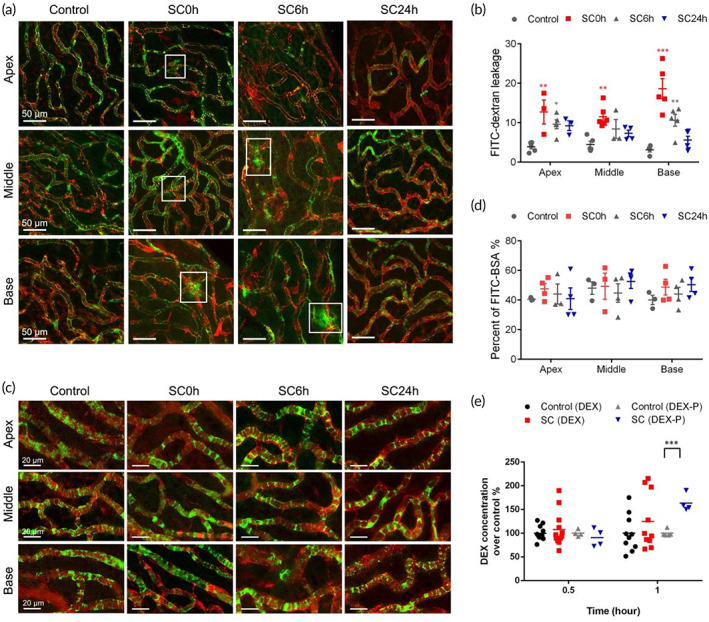
Evaluation of blood‐labyrinth‐barrier permeability in paracellular and transcellular pathway. The blood‐labyrinth barrier permeability for FITC‐dextran (a) and FITC‐BSA (c) in groups of control and 0, 6, and 24 h after sound conditioning (SC) in apical, middle, and basal turns. (b) Quantifications of FITC‐dextran leakage. (d) The percentage of the endothelial area filled with FITC‐BSA. (e) Cochlear concentrations of DEX and DEX‐P in control and SC groups (n = 5). *p < 0.05, **p < 0.01, and ***p < 0.001 versus control.