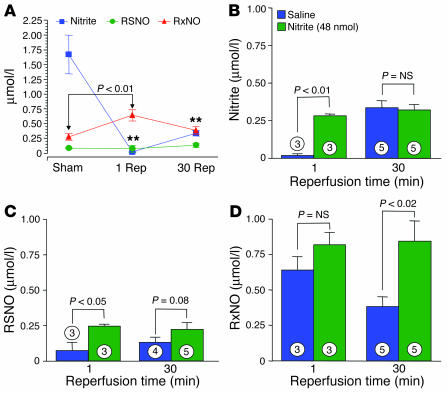
Figure 3.
Blood and liver tissue levels of nitrite, RSNO, and RxNO. (A) Liver nitrite, RSNO, and RxNO levels (μmol/l) in animals (n = 3–5 per group) subjected to sham hepatic I/R (Sham) or to hepatic ischemia plus either 1 minute (1 Rep) or 30 minutes (30 Rep) of reperfusion. Experiments are saline-treated controls without nitrite. **P < 0.001 vs. baseline. (B) Liver tissue nitrite levels in mice (n = 3–5 per group) subjected to hepatic I/R injury. (C) Liver tissue RSNO levels (μmol/l) in mice (n = 3–5 per group) subjected to hepatic ischemia and varying periods of reperfusion. (D) Hepatic tissue RxNO levels (μmol/l) after hepatic ischemia and reperfusion in mice (n = 3–5 per group). Experiments in B–D compare saline-treated controls to those with nitrite treatment (48 nmol). Numbers inside bars indicate the number of mice investigated in each group.

