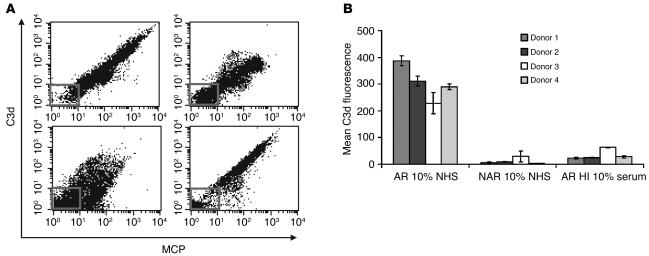
Figure 3.
FACS analysis of C3d deposition on viable spermatozoa exposed to 10% autologous serum. (A) Each FACS plot represents a single donor and is gated on viable spermatozoa. The correlation between the acrosome reaction (as measured by MCP staining) and complement deposition (as measured by C3d staining) is observed in all 4 donors. The inset box in each FACS plot represents the MCP- and C3d-negative population. (B) Mean C3d fluorescence of viable AR and non-AR (NAR) spermatozoa exposed to 10% normal human serum (NHS) or heat-inactivated (HI) human serum. Mean ± SD for a minimum of 3 experiments per donor is shown.

