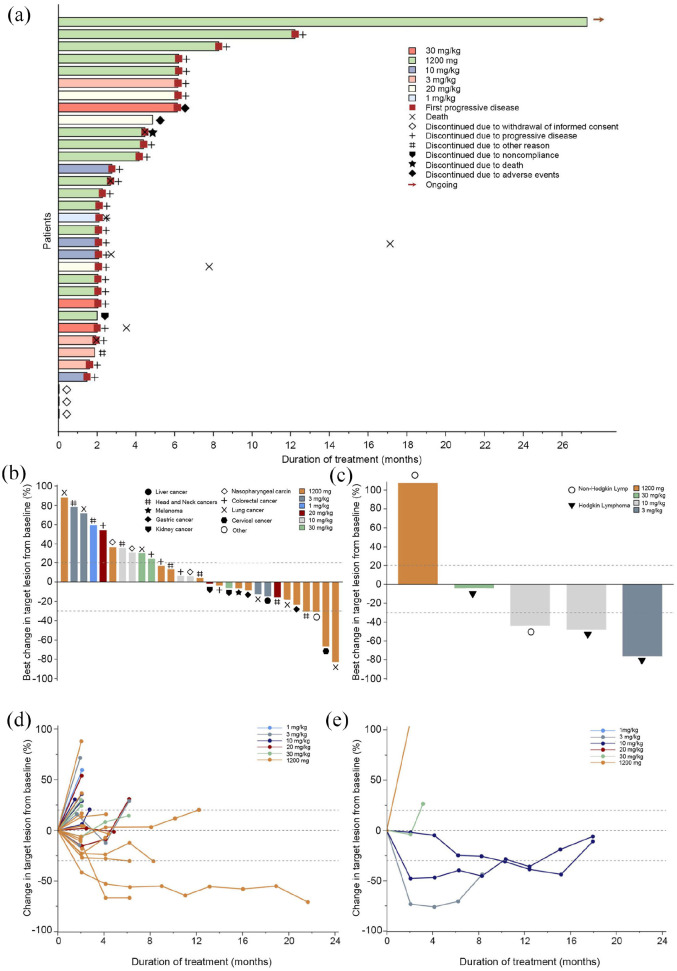
Figure 3.
Tumor response. (a) Time to response and duration of response. Each bar represents one patient. (b) Waterfall plot of maximum percent change in tumor size of solid tumors (n = 29) from baseline as measured by Response Evaluation Criteria in Solid Tumors version 1.1 (RECIST 1.1). (c) Waterfall plot of maximum percent change in tumor size of hematologic malignancies (n = 5) from baseline as measured by Lugano 2014 criteria. (d) Percentage change in tumor size of solid tumors (n = 29) from baseline as measured by RECIST 1.1. (e) Percentage change in tumor size of hematologic malignancies (n = 5) from baseline as measured by Lugano 2014 criteria.
Figure (d) did not include one patient in the 3 mg/kg cohort who developed disease progression that did not reach the first scheduled tumor assessment.

