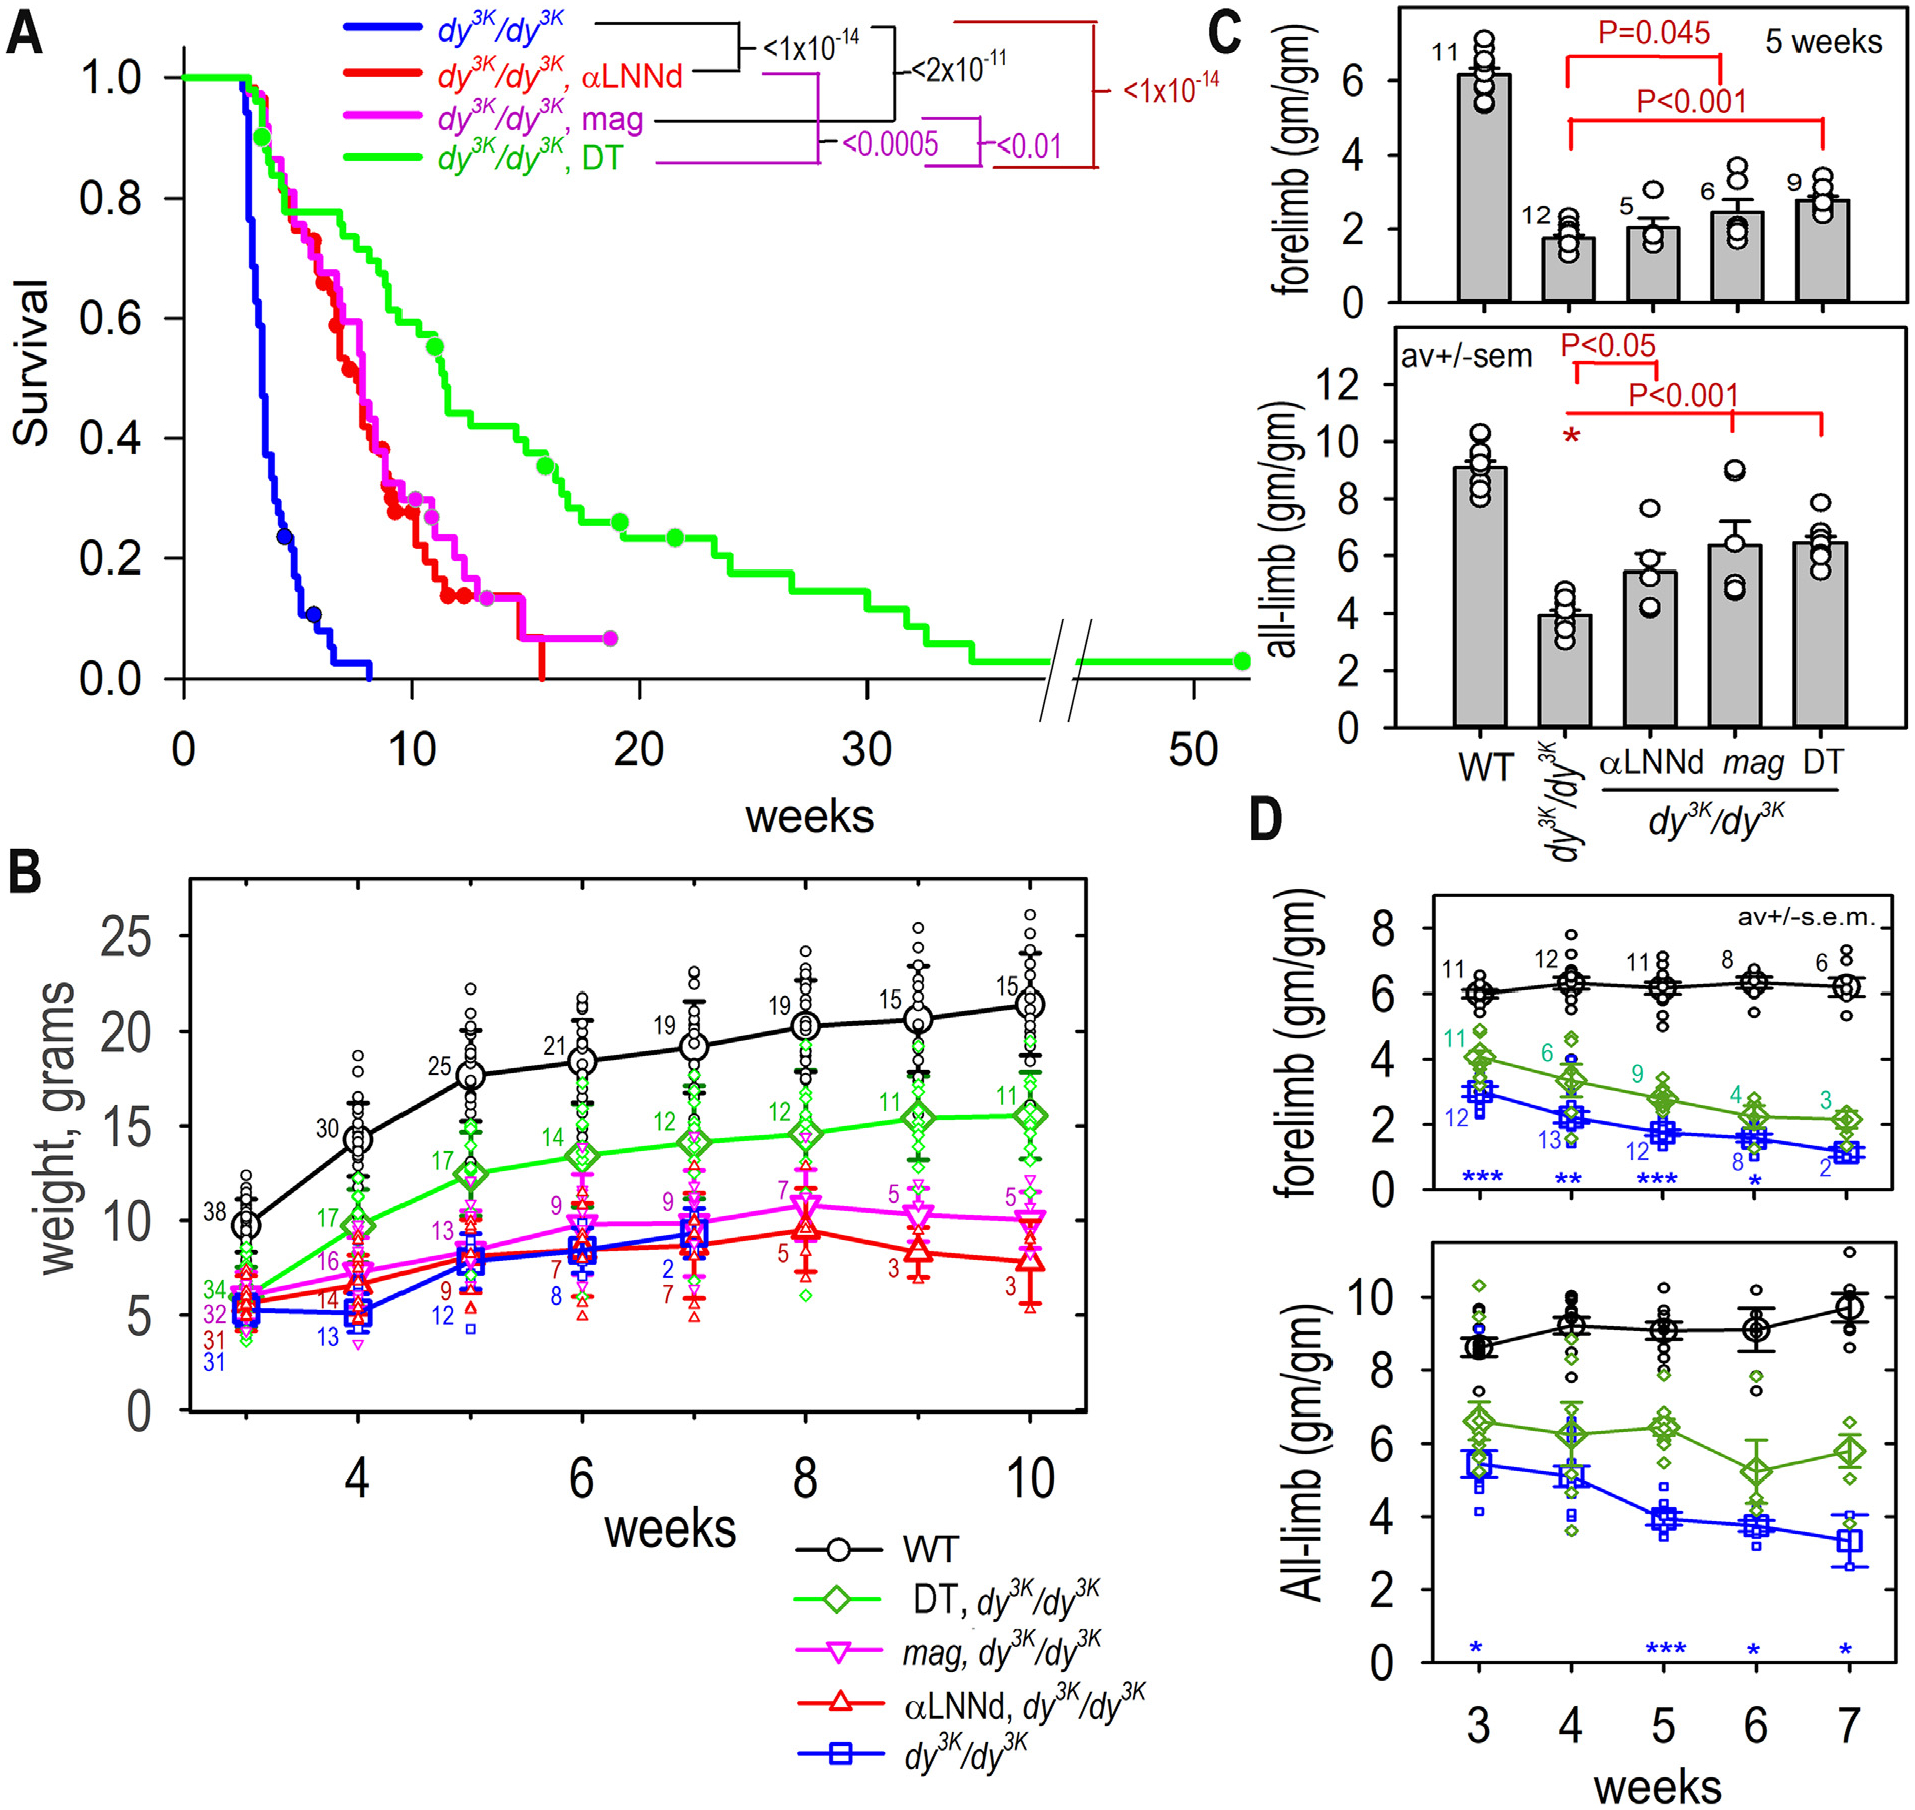
Fig. 2. Transgenic muscle expression of linker proteins improvement of survival, weight gain and grip endurance.

A. Mouse survival. Kaplan-Meier survival with log-rank analysis. Censored data (following approved humane guidelines) for sacrificed mice indicated with dots. Log-rank probabilities comparing the different mouse groups are shown above graph (from 50 dy3K/dy3K, 58 αLNNd-dy3K/dy3K. 36 mag-dy3K/dy3K, and 49 DT-dy3K/dy3K mice). B. Mouse weights. WT, dystrophic and dystrophic mice expression one or two transgenes were weighed at the indicated times (av. ± s.d. with individual values (open symbols) shown; numbers of mice indicated with small numerals for each averaged data point). C. Specific grip strength, 5 weeks. Comparison of WT, dy3K/dy3K without/with one or both transgenes (av. ± s.e.m. with individual values (open circles) shown. D. Specific grip strength at different ages. Specific grip strengths of DT-dy3K/dy3K, WT and dy3K/dy3K mice at different ages (av. ± s.e.m. with individual values (open circles): ***, P<0.001; **, P<0.01; *, P<0.01 for dy3K/dy3K cf. DT-dy3K/dy3K). P values determined by 1-way ANOVA followed by pairwise Holm-Sidak test (mouse numbers indicated with numerals).
