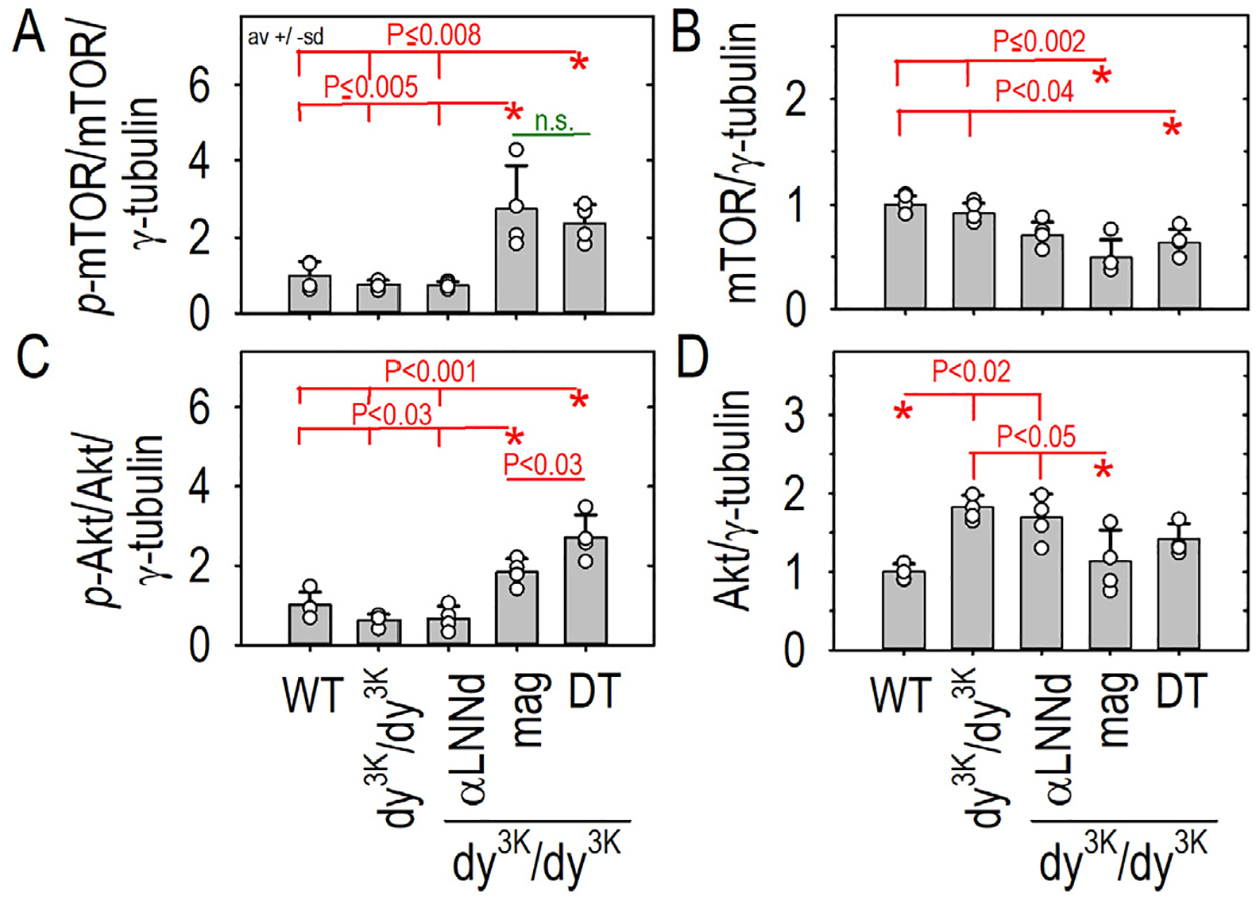
Fig. 5. mTOR and Akt phosphorylation increases in response to miniagrin expression.

Forelimb triceps muscle was obtained from four each of WT and dystrophic (dy3K/dy3K) mice without and with transgene expression at six weeks of age. Muscle was ground and extracted with Triton buffer and analyzed by reducing SDS-PAGE (7.5%) with detection of phosphorylated (A,C) and total (B,D) mTOR and Akt. Av. ± s.d with individual mouse values (open symbols) shown. P values determined by 1-way ANOVA followed by pairwise Holm-Sidak test. Phospho-mTOR and phosphor-Akt were elevated in mag and double transgene expressing dystrophic muscle. Changes in total mTOR and Akt were also detected.
