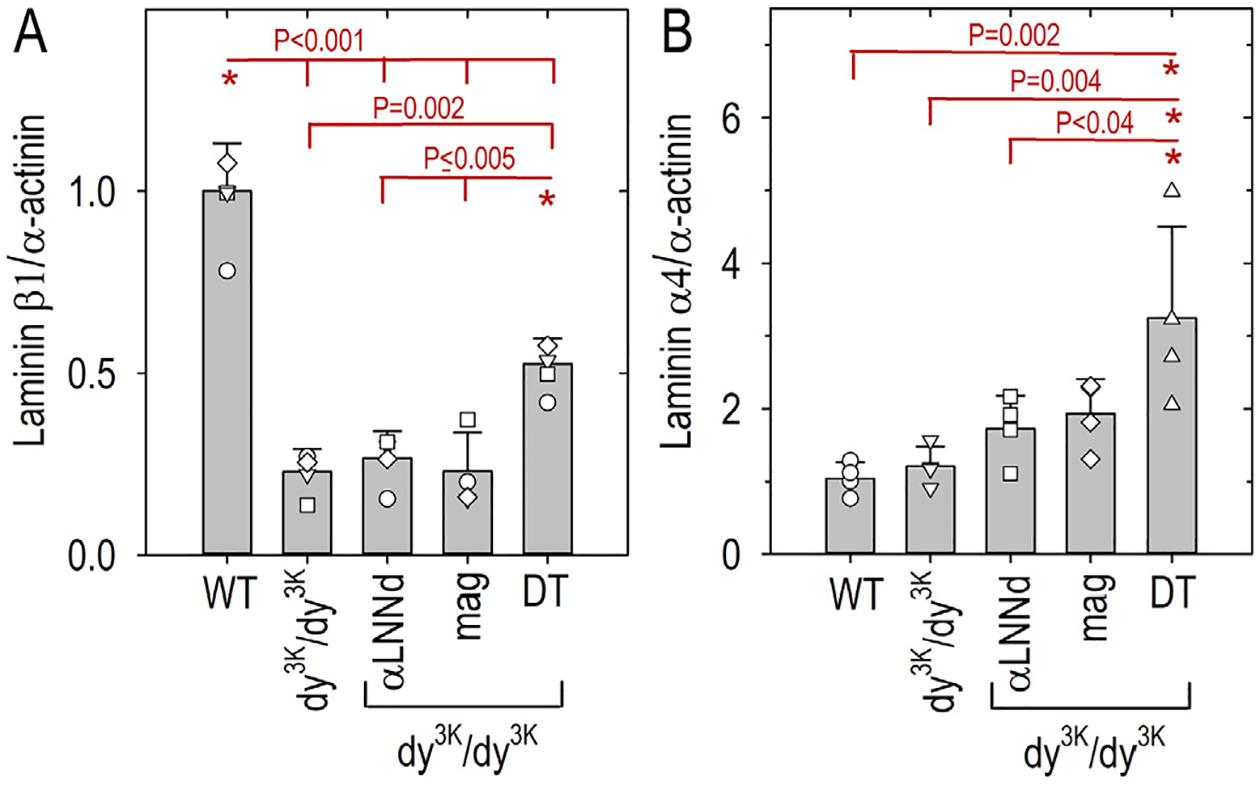
Fig. 6. Laminin subunit protein expression elevations in DT-dy3K/dy3K muscle extract immunoblots.

Forelimb triceps muscle was excised from 3-week-old WT, dy3K/dy3K and dy3K/dy3K-transgene mice (4 animals per condition), ground, washed with Triton X-100 buffer to remove non-BM laminins, then extracted with SDS/EDTA buffer. The extracts were electrophoresed by SDS-PAGE, trans-blotted, and probed with either rat mAb anti-Lmβ1 (panel A) or chick polyclonal anti-Lmα4 (panel B) antibodies and anti-α-actinin antibody as a loading control (immunoblots shown in supplement). Graphs show the laminin subunit/α-actinin ratios (av. ± s.d.). Individual mouse values (open symbols) are superimposed on the average bars. P values determined by 1-way ANOVA followed by pairwise Holm-Sidak test. DT-dy3K/dy3K Lmβ1 values were significantly higher than dy3K/dy3K without or with single transgenes but lower than WT values and Lmα4 values were higher in DT-dy3K/dy3K compared to WT and mag- dy3K/dy3K.
