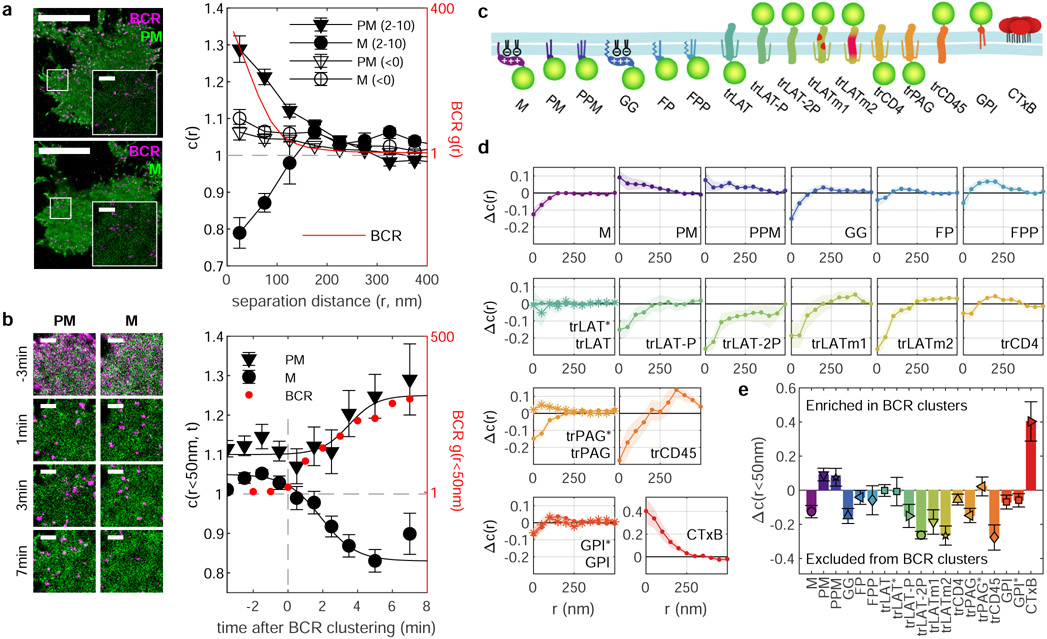
Figure 1: BCR clustering produces membrane domains that differently sort plasma membrane-anchored fluorescent proteins.
a, Reconstructed live-cell super-resolution images of CH27 B cells imaged between 2 and 10 min after BCR clustering and quantification through the spatial-temporal cross-correlation function c(r,τ) extrapolated to τ=0 both before (<0) and after (2-10) BCR clustering for the same single cells. Values of c(r)=1 indicate a random co-distribution, c(r)>1 indicate co-clustering, and c(r)<1 indicate exclusion. Error bars represent uncertainty in extrapolating to τ=0 in single cells. The BCR autocorrelation (g(r)) is shown (red) on a different scale (right axis) evaluated over the same time-period. Here, τ=0.5s is shown to reduce the impact of multiple localizations of the same fluorophore (described in Extended Data Fig. 1) b, Images of the region of interest from a reconstructed from 2min of acquired data centered at the time indicated. Anchor partitioning over time is quantified using the amplitude of cross-correlations (c(r<50nm)) averaged over n=6 cells for each anchor and error-bars represent the SEM. The amplitude of BCR autocorrelations (red points) shows the evolution of BCR clustering averaged over all n=12 cells. Lines are drawn to guide the eye and are not a fit to any theory. Points for individual cells are provided in Supplementary Fig. 2. Scale-bars are 10μm in a and are 1μm in a insets and b. c, Schematic representation of anchors used in this study. d, Traces showing the change in c(r) between anchors and BCR between 2 and 10 min after BCR clustering and the curve obtained for times before BCR clustering (Δc(r)). Error bounds indicated by the shaded region represent the SEM over at least n=5 cells. Representative images of cells are shown in Extended Data Fig. 2 and curves for c(r) before and after clustering are shown in Extended Data Fig. 3. e, Summary of Δc(r) for separation distances less than 50nm redrawn from d. In d and e, * symbols and anchor labels ending in * indicate that values are from experiments where BCR was clustered in the presence of 5μM PP2. Cell numbers interrogated for each anchor and distributions of c(r<50nm) and Δc(r<50nm) are shown in Supplementary Fig. 3.

