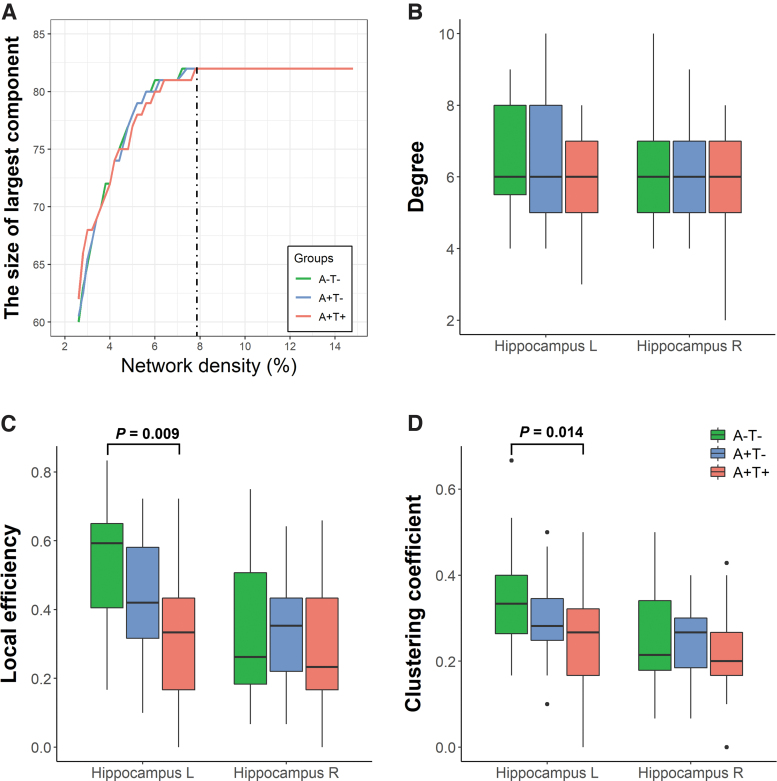
FIG. 3.
(A) The graph shows the largest connected component size of the network in A−T− (green line), A+T− (blue line), and A+T+ (red line) groups as a function of network density. The largest component size tends to increase with higher density. The dashed line indicates the lowest density threshold (7.8%) in which networks of the 3 groups included all nodes (i.e., 82 regions). Local topological properties of the hippocampus such as degree (B), local efficiency (C), and clustering coefficient (D) were calculated under the density threshold of 7.8%. Significant differences in local efficiency and clustering coefficient in the left hippocampus were found between the A+T+ and A−T− groups. The box plots show the median and interquartile range. A−/A+, negative/positive amyloid-PET; L, left; PET, positron emission tomography; R, right; T−/T+, negative/positive tau-PET.

