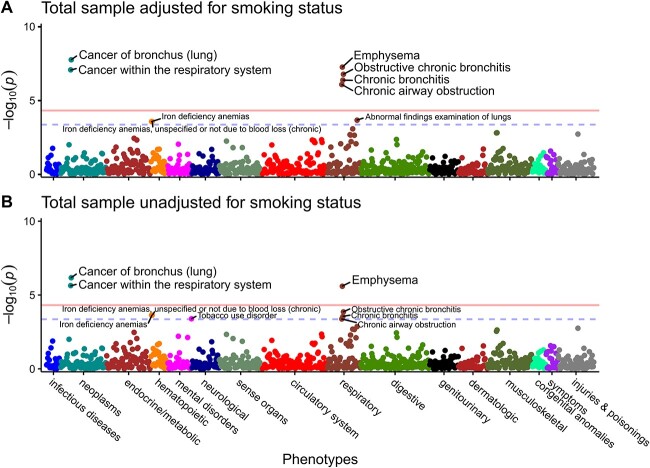
Figure 1.
Neoplasms and respiratory diseases clusters associated with CYP2A6 wGRS in the total UK Biobank sample. Manhattan plots for PheWAS results adjusted for age at recruitment, genetic sex, 10 PCs, with (A); and without (B) smoking status (current vs former vs never-smokers). Each data point represents one phenotype in its respective disease category on the x-axis plotted against the association significance (−log10 P). The horizontal solid lines represent the phenome-wide significant threshold using Bonferroni correction (P = 0.05/1029 = 4.86 × 10⁻⁵), while the blue horizontal dashed lines represent the nominal association thresholds (5% FDR equivalent to P = 4.37 × 10⁻⁴). PheWAS sample (N = 305 224–395 887); cases and controls sample sizes are found in Supplementary Table 2.

