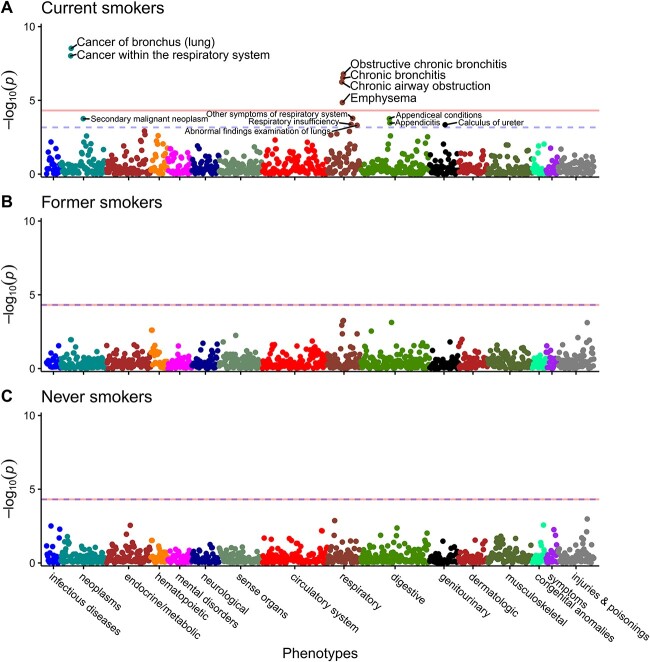
Figure 3.
Smoking status stratified PheWAS suggesting a role of smoking on disease risk. Manhattan plots for PheWAS results in current smokers (A); former smokers (B); and never smokers (C) adjusting for age at recruitment, genetic sex, and 10 PCs. Each data point represents one phenotype in its respective disease category on the x-axis plotted against the association significance (−log10 P). The horizontal solid lines represent the phenome-wide significant threshold using Bonferroni correction (P = 0.05/1029 = 4.86 × 10⁻⁵), while the blue horizontal dashed lines represent the nominal association thresholds (5% FDR equivalent to P = 6.80 × 10⁻⁴ for (A); 4.86 × 10⁻⁵ for (B) and (C)). Constipation surpassed the nominal association threshold in current smokers but was omitted by the plotting software. PheWAS sample (N = 27 822–215 274); cases and controls sample sizes are found in Supplementary Table 2.

