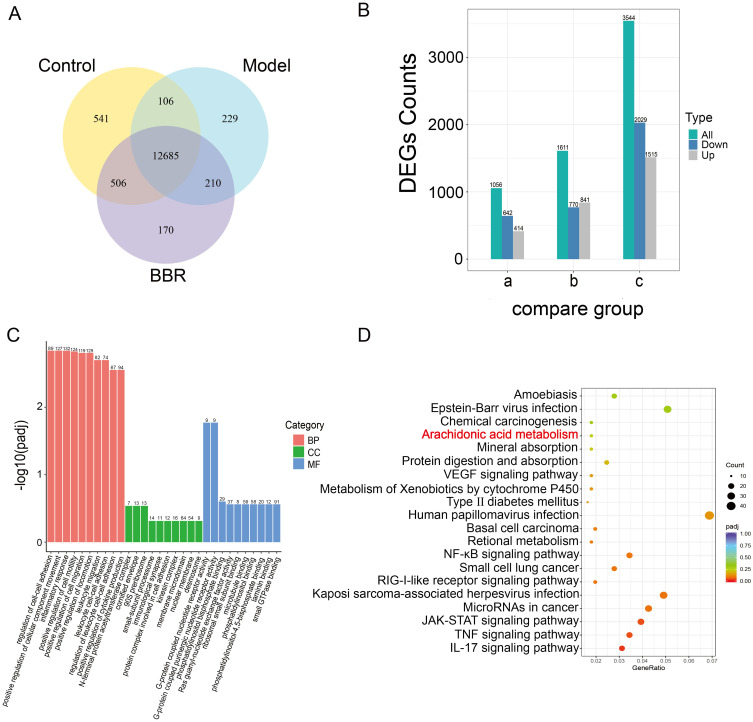
Figure 3.
Transcriptomics profiling of gastric tissues from different groups. (A) Venn diagram showing co-expressed genes among the Control, Model and BBR groups. (B) Bar chart showing DEGs of the compared groups. a. BBR vs Control; b. BBR vs Model; c. Model vs Control. (C and D) GO functional enrichment and KEGG pathway enrichment results for DEGs in BBR vs Model.

