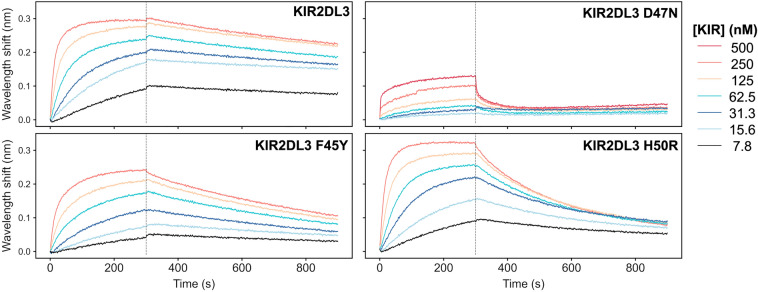
Figure 5.
The high-affinity interaction between lirilumab and KIR2DL3 is affected by polymorphisms present in KIR2DL3 variants and in KIR2DS4. Biolayer interferometry kinetics plots are shown for lirilumab (IgG1) and three KIR2DL3 mutants in neutral pH conditions. In each assay, IgG1 lirilumab was loaded onto AHC sensor tips and equilibrated to assay buffer prior to analyte binding. Each data series consists of 6 two-fold dilutions starting at an analyte concentration of 250 nM (except KIR2DL3 D47N, where the peak concentration is 500 nM). Representative plots from among three assay replicates are shown.

