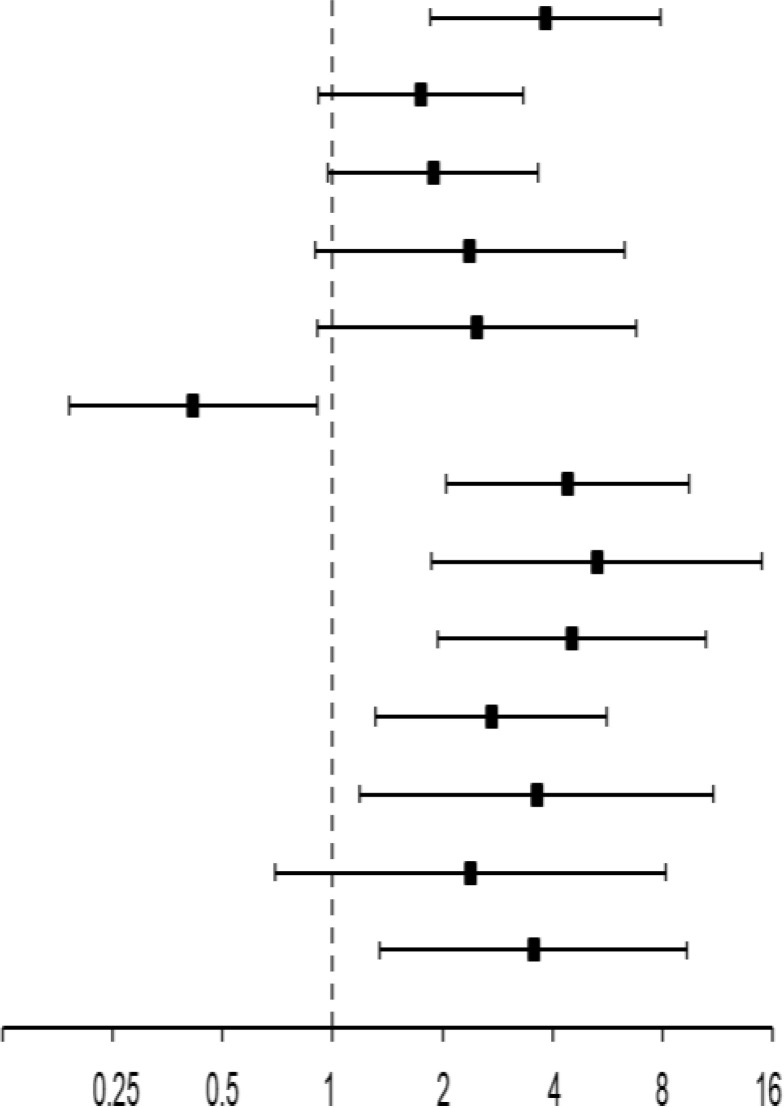
Table 3.
Independent predictors (Pi) building the multivariate Cox proportional hazard regression model (21, 22) for progression-free survival data-driven extracted via the stepwise-forward likelihood ratio selection method of covariates (29–31) among HPV-driven head and neck squamous cell carcinoma.
| Covariate | Ref. | Characteristic | PFS events n (%) | p-value univariate | HR | (95% CI) | p-value multi-variate | Loss in χ 2 for deleted term | p-value for deleted term | p-value for bootstrap | Natural logarithm ln HR | |
|---|---|---|---|---|---|---|---|---|---|---|---|---|
| Alcohol (g/day) | <60 | > 60 | 14 (73.7) | 0.0002 | 3.839 | (1.858 –7.931) |

|
0.0003 | 11.955 | 0.0005 | 0.0040 | 1.345 |
| Localization | OPSCC | HNSCC | 20 (54.1) | 0.0743 | 1.747 | (0.917 –3.327) | 0.0897 | 2.896 | 0.0888 | 0.1508 | 0.558 | |
| T category | Other T | T4 | 16 (61.5) | 0.0457 | 1.884 | (0.969 –3.664) | 0.0619 | 3.323 | 0.0683 | 0.1209 | 0.633 | |
| ENE | N0 or ENE- | ENE+ | 18 (52.9) | 0.2642 | 2.374 | (0.894 –6.304) | 0.0826 | 2.888 | 0.0892 | 0.1928 | 0.865 | |
| Therapy | Op+PORCT | Other | 26 (41.9) | 0.6672 | 2.488 | (0.910 –6.803) | 0.0759 | 3.064 | 0.0800 | 0.1818 | 0.911 | |
| A1C | Non-carrier | Carrier | 29 (44.6) | 0.3678 | 0.415 | (0.190 –0.903) | 0.0266 | 4.896 | 0.0269 | 0.0579 | -0.880 | |
| B12C | Non-carrier | Carrier | 28 (62.2) | 0.0075 | 4.403 | (2.049 –9.463) | 0.0001 | 15.488 | 0.0001 | 0.0040 | 1.482 | |
| A11 | Non-carrier | Carrier | 6 (60.0) | 0.1416 | 5.295 | (1.870 –14.99) | 0.0017 | 8.076 | 0.0045 | 0.0050 | 1.667 | |
| B51 | Non-carrier | Carrier | 9 (64.3) | 0.0220 | 4.522 | (1.939 –10.54) | 0.0005 | 10.175 | 0.0014 | 0.0050 | 1.509 | |
| DR15 | Non-carrier | Carrier | 13 (52.0) | 0.2515 | 2.719 | (1.310 –5.642) | 0.0072 | 6.867 | 0.0088 | 0.0340 | 1.000 | |
| DQB1 hom | Non-carrier | Carrier | 9 (50.0) | 0.5926 | 3.621 | (1.189 –11.03) | 0.0235 | 4.350 | 0.0037 | 0.0230 | 1.287 | |
| A3-B18 | Non-carrier | Carrier | 4 (57.1) | 0.7324 | 2.387 | (0.697 –8.177) | 0.1662 | 1.693 | 0.1931 | 0.1648 | 0.870 | |
| A1-B8 | Non-carrier | Carrier | 7 (53.8) | 0.8396 | 3.548 | (1.347 –9.345) | 0.0104 | 5.689 | 0.0171 | 0.0400 | 1.266 |
Shown are the number of events out of 44 events associated with each Pi in total and the percentage of patients sharing the characteristic experiencing an event, the p-value from univariate analysis, the hazard ratio (HR), and two-sided 95% confidence interval (95% CI) accompanied by the respective p-value as well as the loss in χ2 and the associated p-value for omitting the covariate (for the deleted term), the p-value from bootstrapping applying 1,000 iterations (29), and the natural logarithm (ln) of the HR used for summarizing the individual patient’s risk according to his individual characteristics. Significant p-values are shown in bold.
