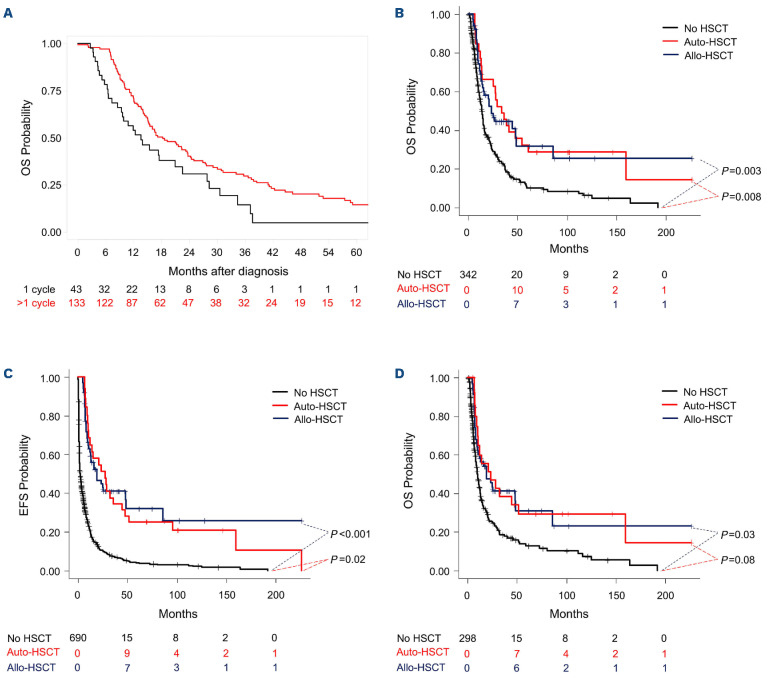
Figure 4.
Impact of post-remission therapy. (A) Overall survival (OS) according to cycles of intensive treatment (1 cycle vs. >1 cycle) in those patients withdrawn according to physicians’ criteria, patient decision or failure of mobilization (n=176). (B) Simon-Makuch plot of OS according to hematopoietic stem cell transplantation (HSCT) in first complete remission/complete remission with incomplete (CR/CRi) (allogeneic HSCT [allo-HSCT] vs. autologous HSCT [auto-HSCT] vs. no HSCT). (C) Simon-Makuch plot of event-free survival (EFS) according to HSCT in first CR/CRi (allo-HSCT vs. auto-HSCT vs. no HSCT). (D) Simon-Makuch plot of OS in the CPX-351-like cohort according to HSCT in first CR/CRi (allo-HSCT vs. auto-HSCT vs. no HSCT).

