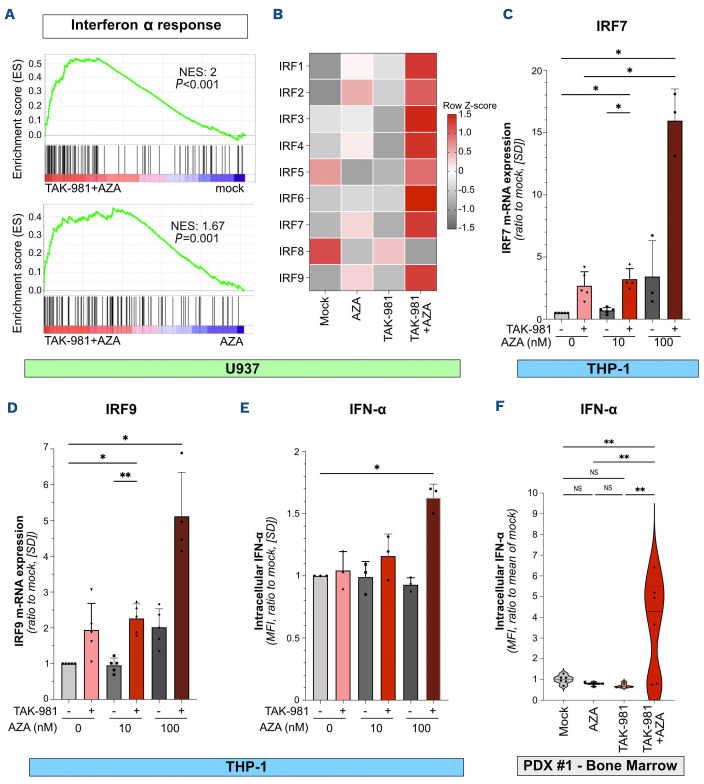
Figure 6.
TAK-981 and 5-azacytidine combination activates type-1 interferon secretion by acute myeloid leukemia cells. (A) Gene set enrichment analysis plot for genes involved in interferon α (IFN-α) response in TAK-981+AZA treated U937 cells compared to mock- (upper panel) and 5-azacytidine (AZA)- (lower panel) treated cells. (B) Heatmap representing the RNA-sequencing results for the expression of interferon regulatory factor (IRF) in U937 cells. (C, D) mRNA expression of IRF7 (C) and IRF9 (D) was analyzed by quantitative reverse transcription polymerase chain reaction (qRT-PCR) in THP-1 cells treated for 72 hours with 10 nM TAK-981 and the indicated concentrations of AZA. Results were normalized to GAPDH mRNA levels and expressed as ratio to mock-treated cells (N=3-5, mean +/- standard deviation [SD], all conditions were compared using RM one-way ANOVA test, only those with significant P values are shown). (E) THP-1 cells were treated for 3 consecutive days with TAK-981 (10 nM) and/or AZA (10 nM or 100 nM). After 8 days, cells were collected and the production of intracellular IFN-α was analyzed by flow cytometry. Background was subtracted and data normalized to the mock-treated condition (N=3, mean +/- SD, all conditions were compared using RM one-way ANOVA test, only those with significant P values are shown). (F) NSG mice were injected with primary patient cells (PDX #1) and treated according to treatment schedule presented in Figure 2A. Spleens (N=6/group) were collected at day 9 after treatment start and the level of intracellular IFN-α in hCD45+ cells was assessed by flow cytometry. Data were normalized to the mean of IFN-α expression (mean fluorescence intensity [MFI]) in mock-treated group of mice. For each group, plain lines represent the median value and dotted lines are the quartiles. Groups were compared using ordinary one-way ANOVA test.

