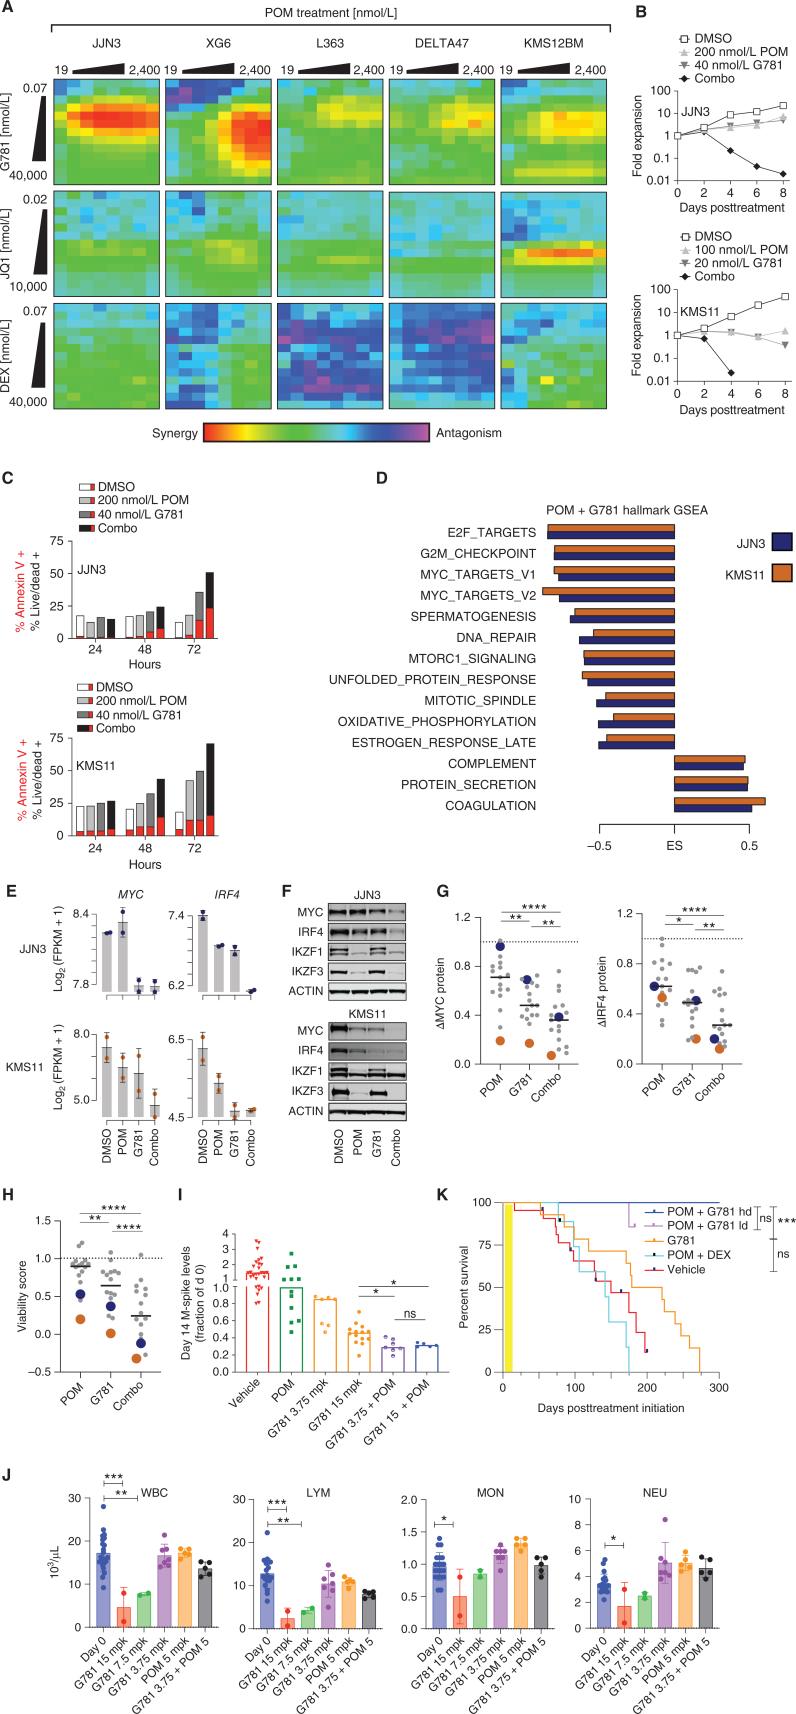
Figure 3.
POM + G781 effectively target MYC and IRF4 in vitro, and synergize in vivo.A, Heat maps showing Loewe synergy scores from 6 HMCLs (listed on top) treated for 72 hours with increasing doses of POM (top; x axis) paired with increasing doses of G781 (top row; y axis), JQ1 (middle row; y axis), or DEX (bottom row; y axis). Red and yellow shading indicates drug synergy whereas blue and purple indicates drug antagonism. B, Growth curves for JJN3 (top) and KMS11 (bottom) cell lines treated with DMSO control or low doses of POM, G781, or the combination. Y axis shows the fold expansion of cells normalized to day 0. The x axis shows days posttreatment. C, Bar graphs of cell lines JJN3 (top) and KMS11 (bottom) showing the percent-positive cells (y axis) as measured by flow cytometry. Cells were treated with 200 nmol/L POM, 40 nmol/L G781, or the combination across three different time points (x axis). For each condition, the fraction of cells positive for Annexin V–only is displayed in red, added to the remaining fraction of cells double-positive for both Annexin V and Live/Dead is shown in grayscale. D, Gene set enrichment analysis (GSEA) of RNA sequencing for 200 nmol/L POM and 40 nmol/L G781, 48-hour treated myeloma cells. Enrichment scores (ES) are shown for significant (FDR ≤0.01) Hallmark gene sets enriched in both JJN3 (blue) and KMS11 (orange) ranked from most significant (top) to least significant (bottom). E, RNA expression of MYC (left) and IRF4 (right) for JJN3 (top) and KMS11 (bottom) for treatment conditions listed. F, Western blots showing changes in MYC, IRF4, IKZF1, and IKZF3 protein levels in JJN3 (top) or KMS11 (bottom) following 72-hour treatment with 200 nmol/L POM, 40 nmol/L G781, or the combination. G, Dot plots of HMCLs showing a change in MYC (left) and IRF4 protein levels 72 hours following treatment with 200 nmol/L POM, 40 nmol/L G781, or combination as detected by western blot relative to DMSO controls. JJN3 (blue) and KMS11 (orange) are denoted in blue and orange, respectively. H, Viability scores of HMCLs shown in G following 96 hours of treatment with 200 nmol/L POM, 40 nmol/L G781, or the combination. Scores were generated using CellTiter-Glo assay with values normalized to DMSO. I, Day 14 M-spike values obtained in WT mice transplanted with Vk29790 tumor line and treated for 2 weeks, twice daily, with 50 mpk of POM, 3.75 mpk G781, 15 mpk G781, or a POM + G781 combination. Values are normalized to day 0 M-spikes. J, hCRBN+ mice were treated with increasing doses of G781, low-dose POM, or low-dose POM + low-dose G781 (x axis) for 21 days, after which cell counts for white blood cells (WBC) lymphoid cells (LYM), mononuclear cells (MON), and neutrophils (NEU) were calculated using a Heska Hematology Analyzer. Day 0 cell counts prior to treatment are shown in blue. K, Survival curve of WT mice transplanted with Vk29790 tumor line and treated for 2 weeks (yellow shading), twice daily, with Vehicle, 50 mpk POM + 10 mpk DEX,15 mpk G781, or combination 50 mpk POM + 15 or 3.75 (ld) mpk G781. P values in K derived from the Mantel–Cox log-ranked χ2 test. For all other panels, P values were determined by unpaired t test. *, P < 0.05; **, P < 0.01; ***, P < 0.001; ****, P < 0.0001. Error bars display SD. Each dot in G and H represents a unique cell line. Each dot in I–J represents an individual mouse.

