. 2023 Sep 27;5(1):34–55. doi: 10.1158/2643-3230.BCD-23-0062

Figure 4.

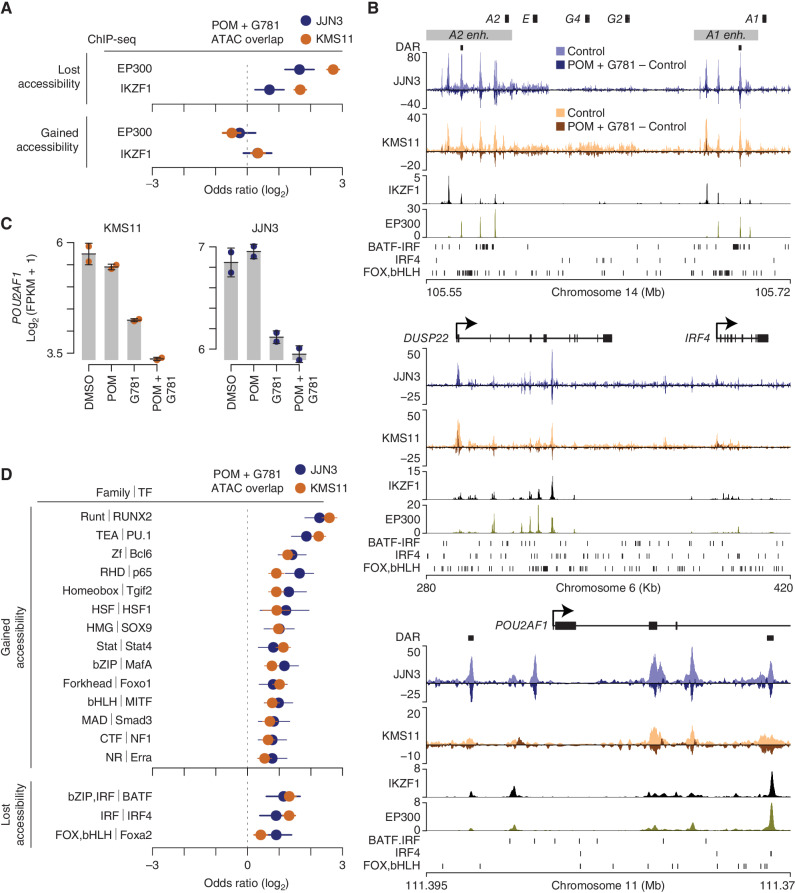
Figure 4. POM + G781 result in chromatin accessibility loss at MM translocated and lineage enhancers. A, Odds ratio of overlap for EP300 and IKZF1 ChIP-seq peaks (MM1S cells) with regions that lost (top) or gained (bottom) chromatin accessibility after POM (200 nmol/L) and G781 (40 nmol/L; POM + G781) treatment in JJN3 (blue) and KMS11 (orange). Confidence intervals (95%) are shown. B, Genome plot of the IGH 3′ enhancers (top), the DUSP22/IRF4 locus (middle), and POU2AF1 (bottom). Differentially accessible regions (DAR) are denoted by black marks. ATAC-seq for JJN3 (blue) and KMS11 (orange) is shown for control cells (lighter shades) along with changes induced by POM + G781 treatment (darker shades). Negative values indicate a loss in chromatin accessibility. IKZF1 and EP300 ChIP-seq are shown below for MM1S myeloma cells. Transcription-factor (TF) binding motifs enriched in regions that lose chromatin accessibility are shown (bottom, each plot). C, RNA expression of POU2AF1 as determined by RNA-seq in KMS11 (left) and JJN3 (right) for DMSO, POM (200 nmol/L), G781 (40 nmol/L), and combination (combo) treated cells. D, Odds ratio of overlap of transcription-factor binding motifs with regions that gain (top) or lose (bottom) chromatin accessibility in JJN3 (blue) and KMS11 (orange). Only TF families enriched (FDR ≤0.01) in both JJN3 and KMS11 are shown with the highest-ranking TF from each family, labelled. TF are from HOMER software with 95% confidence intervals shown. ATAC-seq data (B) represent one replicate and RNA-seq (C) represent two replicates per cell line per condition.

POM + G781 result in chromatin accessibility loss at MM translocated and lineage enhancers. A, Odds ratio of overlap for EP300 and IKZF1 ChIP-seq peaks (MM1S cells) with regions that lost (top) or gained (bottom) chromatin accessibility after POM (200 nmol/L) and G781 (40 nmol/L; POM + G781) treatment in JJN3 (blue) and KMS11 (orange). Confidence intervals (95%) are shown. B, Genome plot of the IGH 3′ enhancers (top), the DUSP22/IRF4 locus (middle), and POU2AF1 (bottom). Differentially accessible regions (DAR) are denoted by black marks. ATAC-seq for JJN3 (blue) and KMS11 (orange) is shown for control cells (lighter shades) along with changes induced by POM + G781 treatment (darker shades). Negative values indicate a loss in chromatin accessibility. IKZF1 and EP300 ChIP-seq are shown below for MM1S myeloma cells. Transcription-factor (TF) binding motifs enriched in regions that lose chromatin accessibility are shown (bottom, each plot). C, RNA expression of POU2AF1 as determined by RNA-seq in KMS11 (left) and JJN3 (right) for DMSO, POM (200 nmol/L), G781 (40 nmol/L), and combination (combo) treated cells. D, Odds ratio of overlap of transcription-factor binding motifs with regions that gain (top) or lose (bottom) chromatin accessibility in JJN3 (blue) and KMS11 (orange). Only TF families enriched (FDR ≤0.01) in both JJN3 and KMS11 are shown with the highest-ranking TF from each family, labelled. TF are from HOMER software with 95% confidence intervals shown. ATAC-seq data (B) represent one replicate and RNA-seq (C) represent two replicates per cell line per condition.